How four different Medicaid disenrollment scenarios would impact hospitals’ net revenue and income
The new quarterly Revenue Cycle Intelligence Benchmarking report is an academic exercise that correlates Medicaid disenrollment with financial results but reveals potential real-world consequences for hospitals.
Aug. 28, 2025

Healthcare industry leaders have described The One Big Beautiful Bill Act passed by Congress and signed into law on July 4, 2025, as a “game changer” for the incumbent sectors of the now $5.6 trillion healthcare industry. A Congressional Budget Office analysis of the new law said the OBBBA will reduce federal healthcare spending by nearly $1.1 trillion by 2034 while over the same period increase the number of uninsured by more than 10 million people.
That is changing the game, especially for revenue cycle leaders at the nation’s hospitals, health systems, and medical practices.
This quarterly revenue cycle benchmarking report from Kodiak forecasts the financial impact of four different Medicaid disenrollment scenarios under the OBBBA on an average hospital. The analysis is an academic exercise that points to potential real-world consequences for hospitals.
Download our latest quarterly KPI benchmarking reports
- May 2025: Closing the revenue cycle performance gap
- February 2025: 3 headwinds facing revenue cycle leaders in 2025
- November 2024: Some payors hit snooze button on Two-Midnight Clock
- August 2024: Death by a thousand requests
- May 2024: Necessity is the mother of claim denials
Introduction
Moving beyond partisan rhetoric, numerous credible sources are attempting to quantify the impact of the healthcare provisions in the OBBBA. Here are some of the numbers so far:
- The OBBBA would reduce budgeted federal spending on Medicaid by $911 billion by 2034, according to an analysis by the Kaiser Family Foundation.
Revenue cycle life before the OBBBA
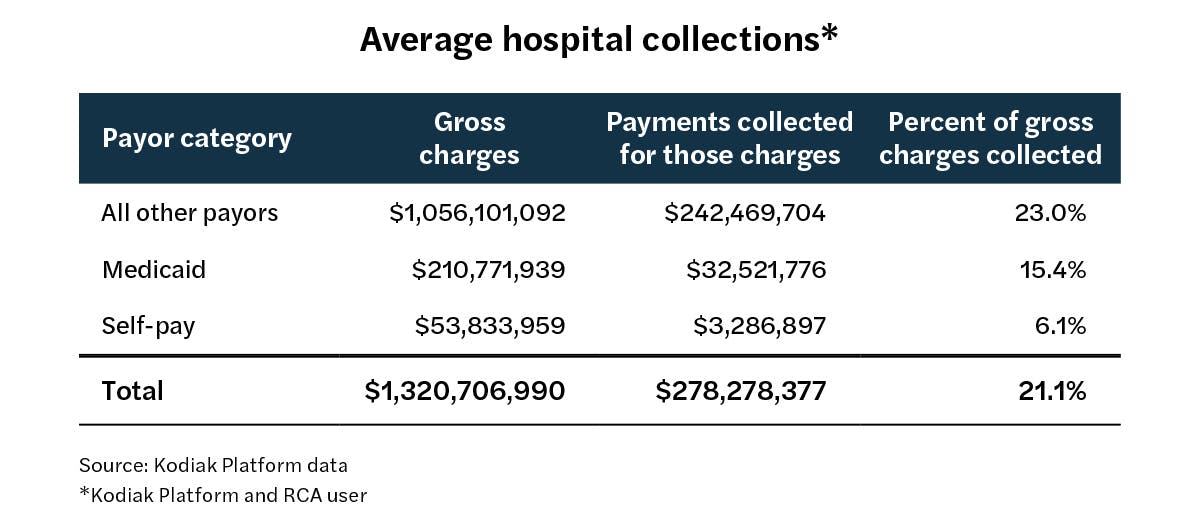
The chart above describes the average hospital in Kodiak’s database of Kodiak Platform and Kodiak RCA users. Overall, the average hospital collects 21.1% of its gross charges from all payors.
Broken down by the three payor categories, the collection rate is 23% for all other payors, 15.4% for Medicaid, and 6.1% for self-pay.

Scenario 1
A 5% drop in Medicaid gross charges that converts to self-pay

The chart above describes what happens when the average hospital in Kodiak’s database of Kodiak Platform and Kodiak RCA users experiences a 5% decline in Medicaid gross charges that becomes a 5% increase in self-pay charges.
The result is a drop in the overall collection rate to 21% from 21.1% and a decline in net revenue of more than $1 million.
Scenario 2
A 10% drop in Medicaid gross charges that converts to self-pay

The chart above describes what happens when the average hospital in Kodiak’s database of Kodiak Platform and Kodiak RCA users experiences a 10% decline in Medicaid gross charges that becomes a 10% increase in self-pay charges.
The result is a drop in the overall collection rate to 20.9% from 21.1% and a decline in net revenue of more than $2 million.
Scenario 3
A 15% drop in Medicaid gross charges that converts to self-pay
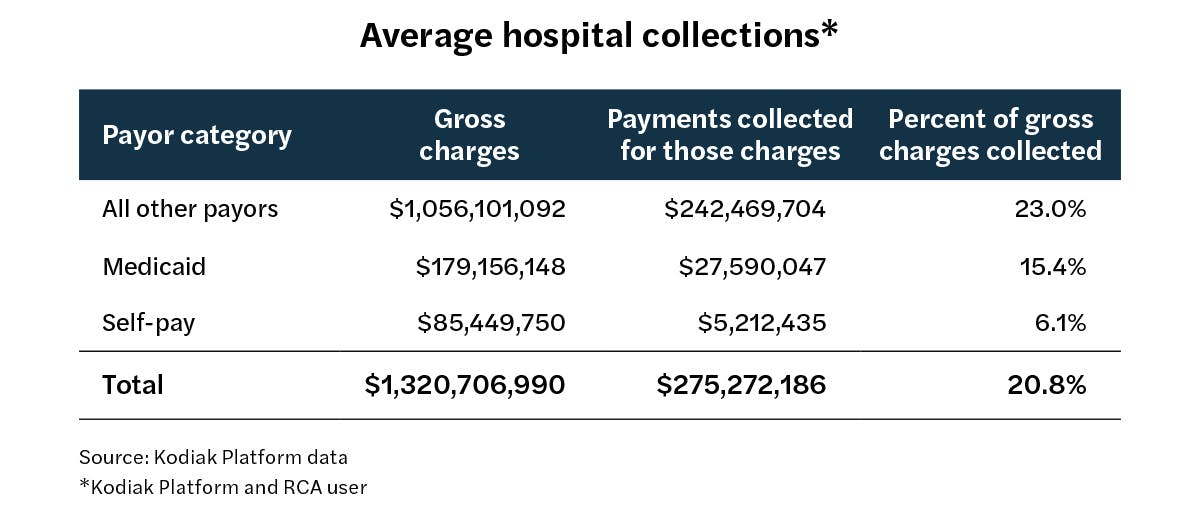
The chart above describes what happens when the average hospital in Kodiak’s database of Kodiak Platform and Kodiak RCA users experiences a 15% decline in Medicaid gross charges that becomes a 15% increase in self-pay charges.
The result is a drop in the overall collection rate to 20.8% from 21.1% and a decline in net revenue of more than $3 million.
Scenario 4
A 20% drop in Medicaid gross charges that converts to self-pay
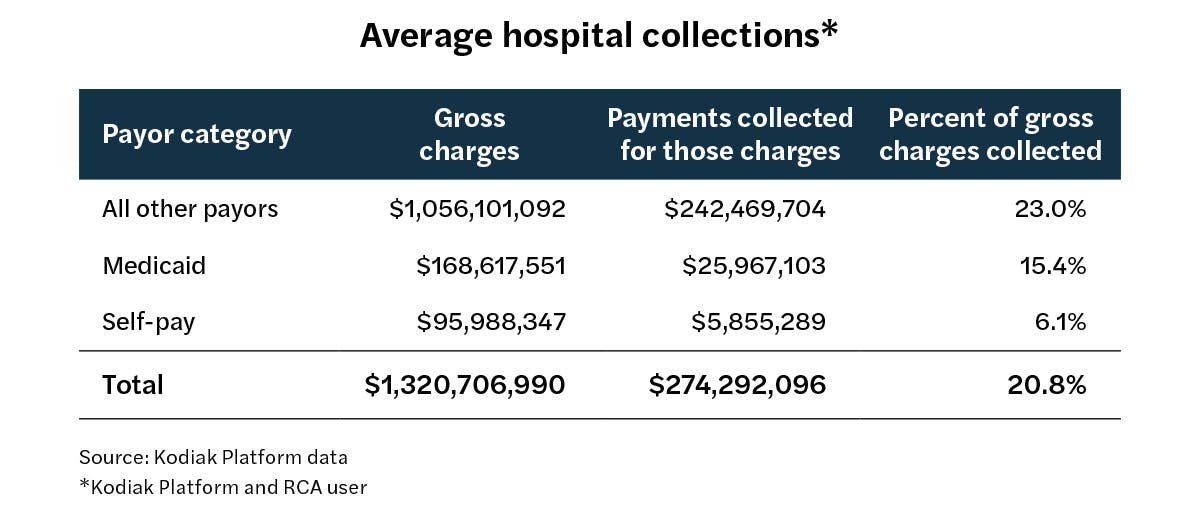
The chart above describes what happens when the average hospital in Kodiak’s database of Kodiak Platform and Kodiak RCA users experiences a 20% decline in Medicaid gross charges that becomes a 20% increase in self-pay charges.
The result is a drop in the overall collection rate to 20.8% from 21.1% and a decline in net revenue of nearly $4 million.

Conclusion
As the above four scenarios illustrate, the average U.S. hospital could experience a decline in net revenue of 0.4% to 1.4% annually absent any other changes in its payor mix other than a shift of Medicaid patients to self-pay patients. In terms of dollars, that’s between a $1 million and $4 million drop in net revenue annually.
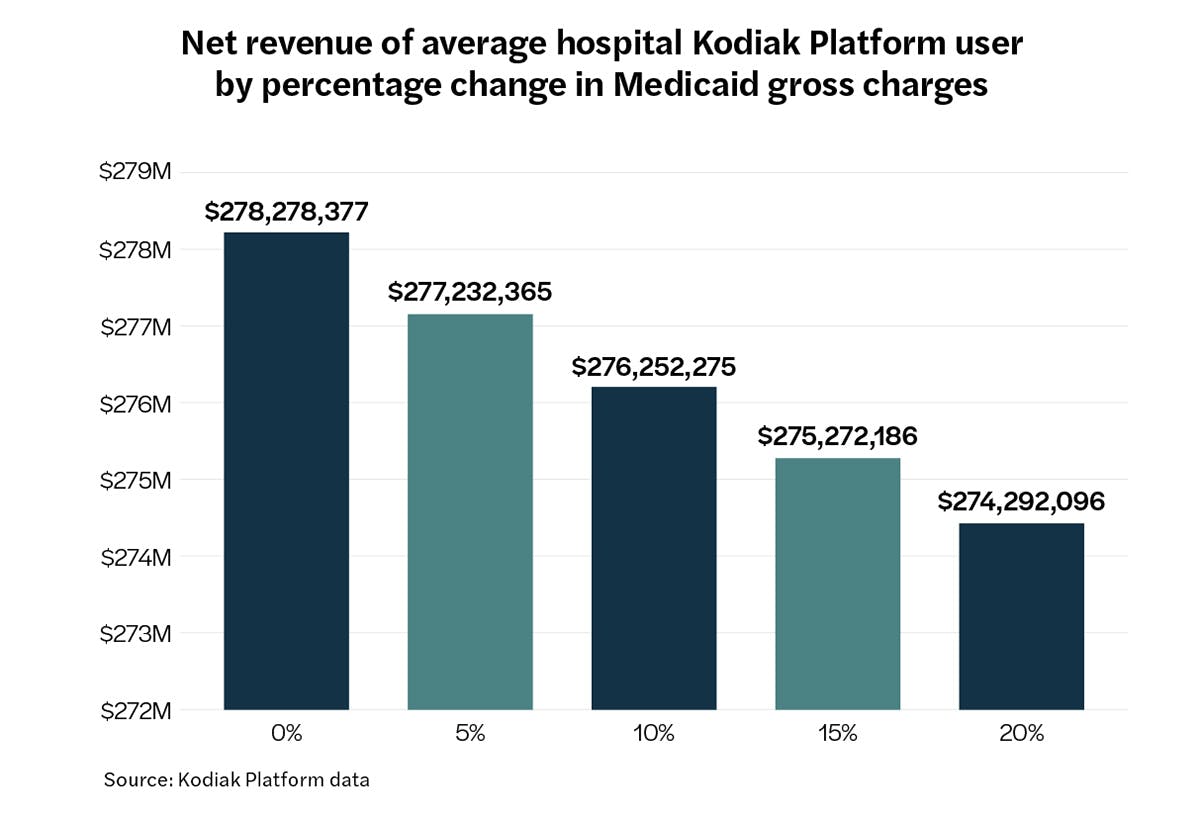
We estimate that hospitals nationwide could see a drop in net revenue of up to $25 billion in one year.
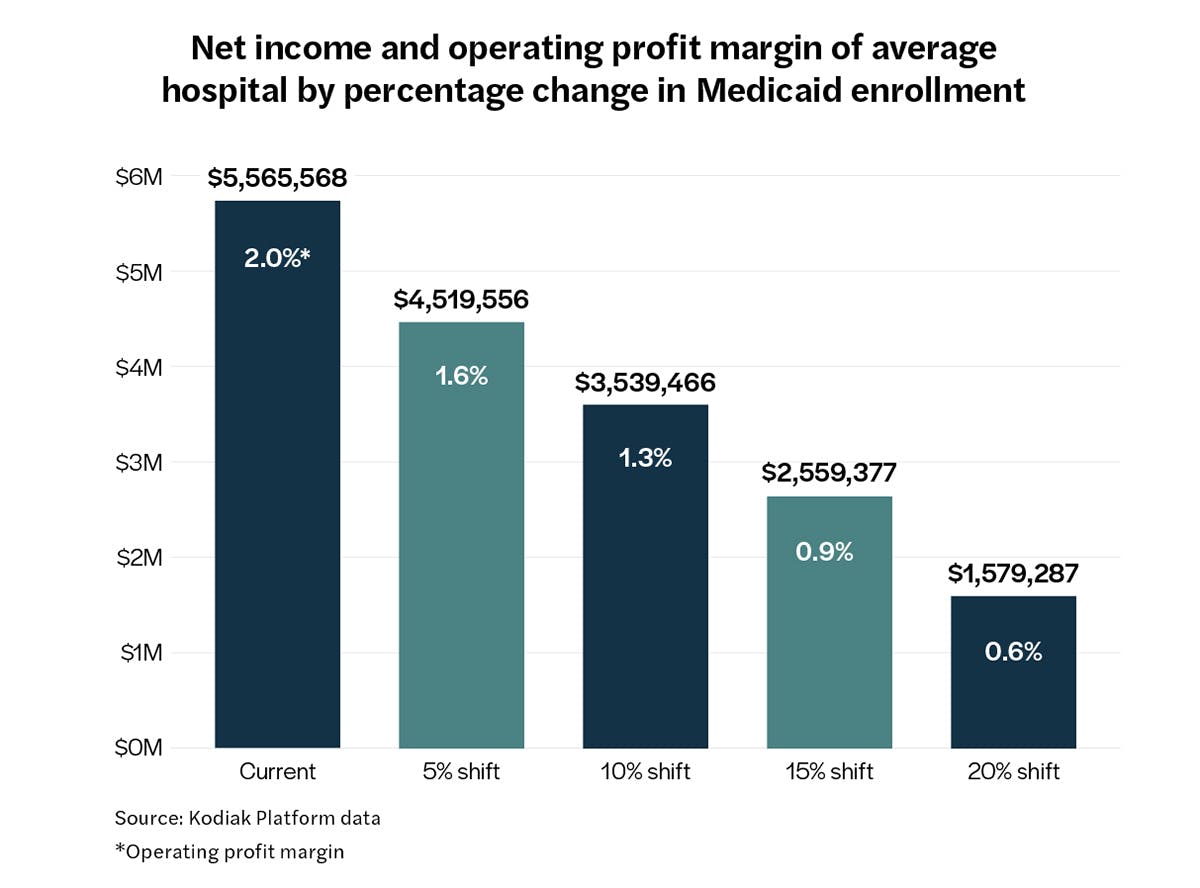
Converted into net income and operating profit margin, the financial impact for the average hospital living on the edge could be devastating. The chart below reflects what would happen to the net income and operating profit margin of the average hospital with about $278.3 million in net revenue and a 2% operating profit margin.
Worst-case scenario: Net income could drop by more than 71% to about $1.6 million, and the operating profit margin could drop by 70% to 0.6% from 2%. Few businesses in any industry could manage a 70% drop in margin.
The scenario isn’t far-fetched: Fitch Ratings reported this month that the median operating profit margin for not-for-profit hospitals last year was just 1.1%. Most of the hospitals in the Kodiak Platform database are not-for-profits.
Scenario planning and action steps

What can hospitals do to prepare themselves for one or more of these scenarios? We recommend that hospitals take the following actions:
- Renew their focus on helping patients meet Medicaid eligibility requirements and get them enrolled or re-enrolled in the program as soon as possible.
- Expand preventive care programs for the uninsured to help them stay as healthy as possible and avoid hospitals and hospital emergency departments if their medical conditions go unmanaged.
- Prepare to reduce their operating costs wherever possible. Unless hospitals make up those declines in net revenue from other payors, that money is gone, and hospitals will need to offset it by savings elsewhere.
The time to scenario plan is now as many of the OBBBA’s Medicaid provisions take effect as early as next year. The revenue cycle specialists at Kodiak can help you calculate your next move.