Closing the revenue cycle performance gap
The May 2025 quarterly Revenue Cycle Intelligence Benchmarking report reveals variations in revenue cycle performance. A mix of strategies and best practices can make your organization a top performer.
May 20, 2025

Unexplained variations in healthcare outcomes are symptomatic of the U.S. healthcare system, giving health services researchers their raison d’etre. Often correlated with lack of standardization in people, processes, and technology, the same patients with the same diagnoses can experience vastly different levels of care, clinical outcomes, costs for care, and medical bills.
Healthcare revenue cycle performance is no different. When we look at revenue cycle key performance indicators, we find wide variations in performance across hospitals and health systems. The good news is smart revenue cycle leaders can explain variations in revenue cycle KPIs and convert them into big opportunities for improvement.
Introduction
We ended our first quarter KPI benchmarking report with a bit of a cliffhanger. We warned intrepid healthcare revenue cycle leaders against three headwinds facing their organizations’ revenue cycle performance in the year ahead:
- Growing initial and final claim denial by all payors.
- Increasing initial request for information claim denials by commercial health plans and by Medicare Advantage plans.
- Commercially insured patients owing more out of pocket but paying less of their share of their medical bills.
Like we said in the report, one is enough to blow a provider organization’s revenue cycle performance off course. Three at once could swamp the boat. We shared a few strategies and tactics that you as a revenue cycle leader could deploy to effectively deal with each of the three headwinds.
The question is, do any or all of these strategies and tactics really work? Is there any room for revenue cycle leaders to improve their organizations’ revenue cycle performance to any meaningful extent?
The answer is a resounding yes.
The proof is in the data—the data from more than 2,100 hospitals and 300,000 physicians that use the Kodiak Revenue Cycle Analytics platform to manage their net revenue and monitor their revenue cycle performance.
For this quarterly KPI benchmarking report, we compared RCA users on eight revenue cycle KPIs. They are the same eight that we use to determine the recipients of our annual Revenue Cycle Performance Awards. For each KPI, we calculated an average for all RCA users, the average for the top 10 RCA users, and the actual KPI for the top RCA user. All data is from 2024.
We found wide variations among the three performance categories on each of the eight KPIs. In more than a few cases, those variations were dramatic. In turn, the findings point to opportunities for many healthcare organizations to dramatically improve their revenue cycle performance. For each of the KPIs, we offered a performance tip to close the performance gap.
Further, we curated three best-performance attributes from interviews with the recipients of this year’s Revenue Cycle Performance Awards. We interviewed leaders from the winning organizations during the March 13, 2025, webinar announcing the recipients. We also shared strategies and tactics that invited members of the Kodiak Revenue Circle are using to turn headwinds into tailwinds to drive their revenue cycle performance.
Unexplained variations in healthcare are common. They don’t have to be in your revenue cycle.
Download our latest quarterly KPI benchmarking reports
- February 2025: 3 headwinds facing revenue cycle leaders in 2025
- November 2024: Some payors hit snooze button on Two-Midnight Clock
- August 2024: Death by a thousand requests
- May 2024: Necessity is the mother of claim denials
Read them all here.

Wide variations in revenue cycle performance
The following charts reveal wide variations in eight critical revenue cycle KPIs among three categories of Kodiak RCA users: all users, top 10 performers, and top performer. All data is from 2024. For each of the eight KPIs, we offer an insight into the data as well as a performance tip to close the gap between your organization and the top performer.
KPI 1: True accounts receivable days
Insight
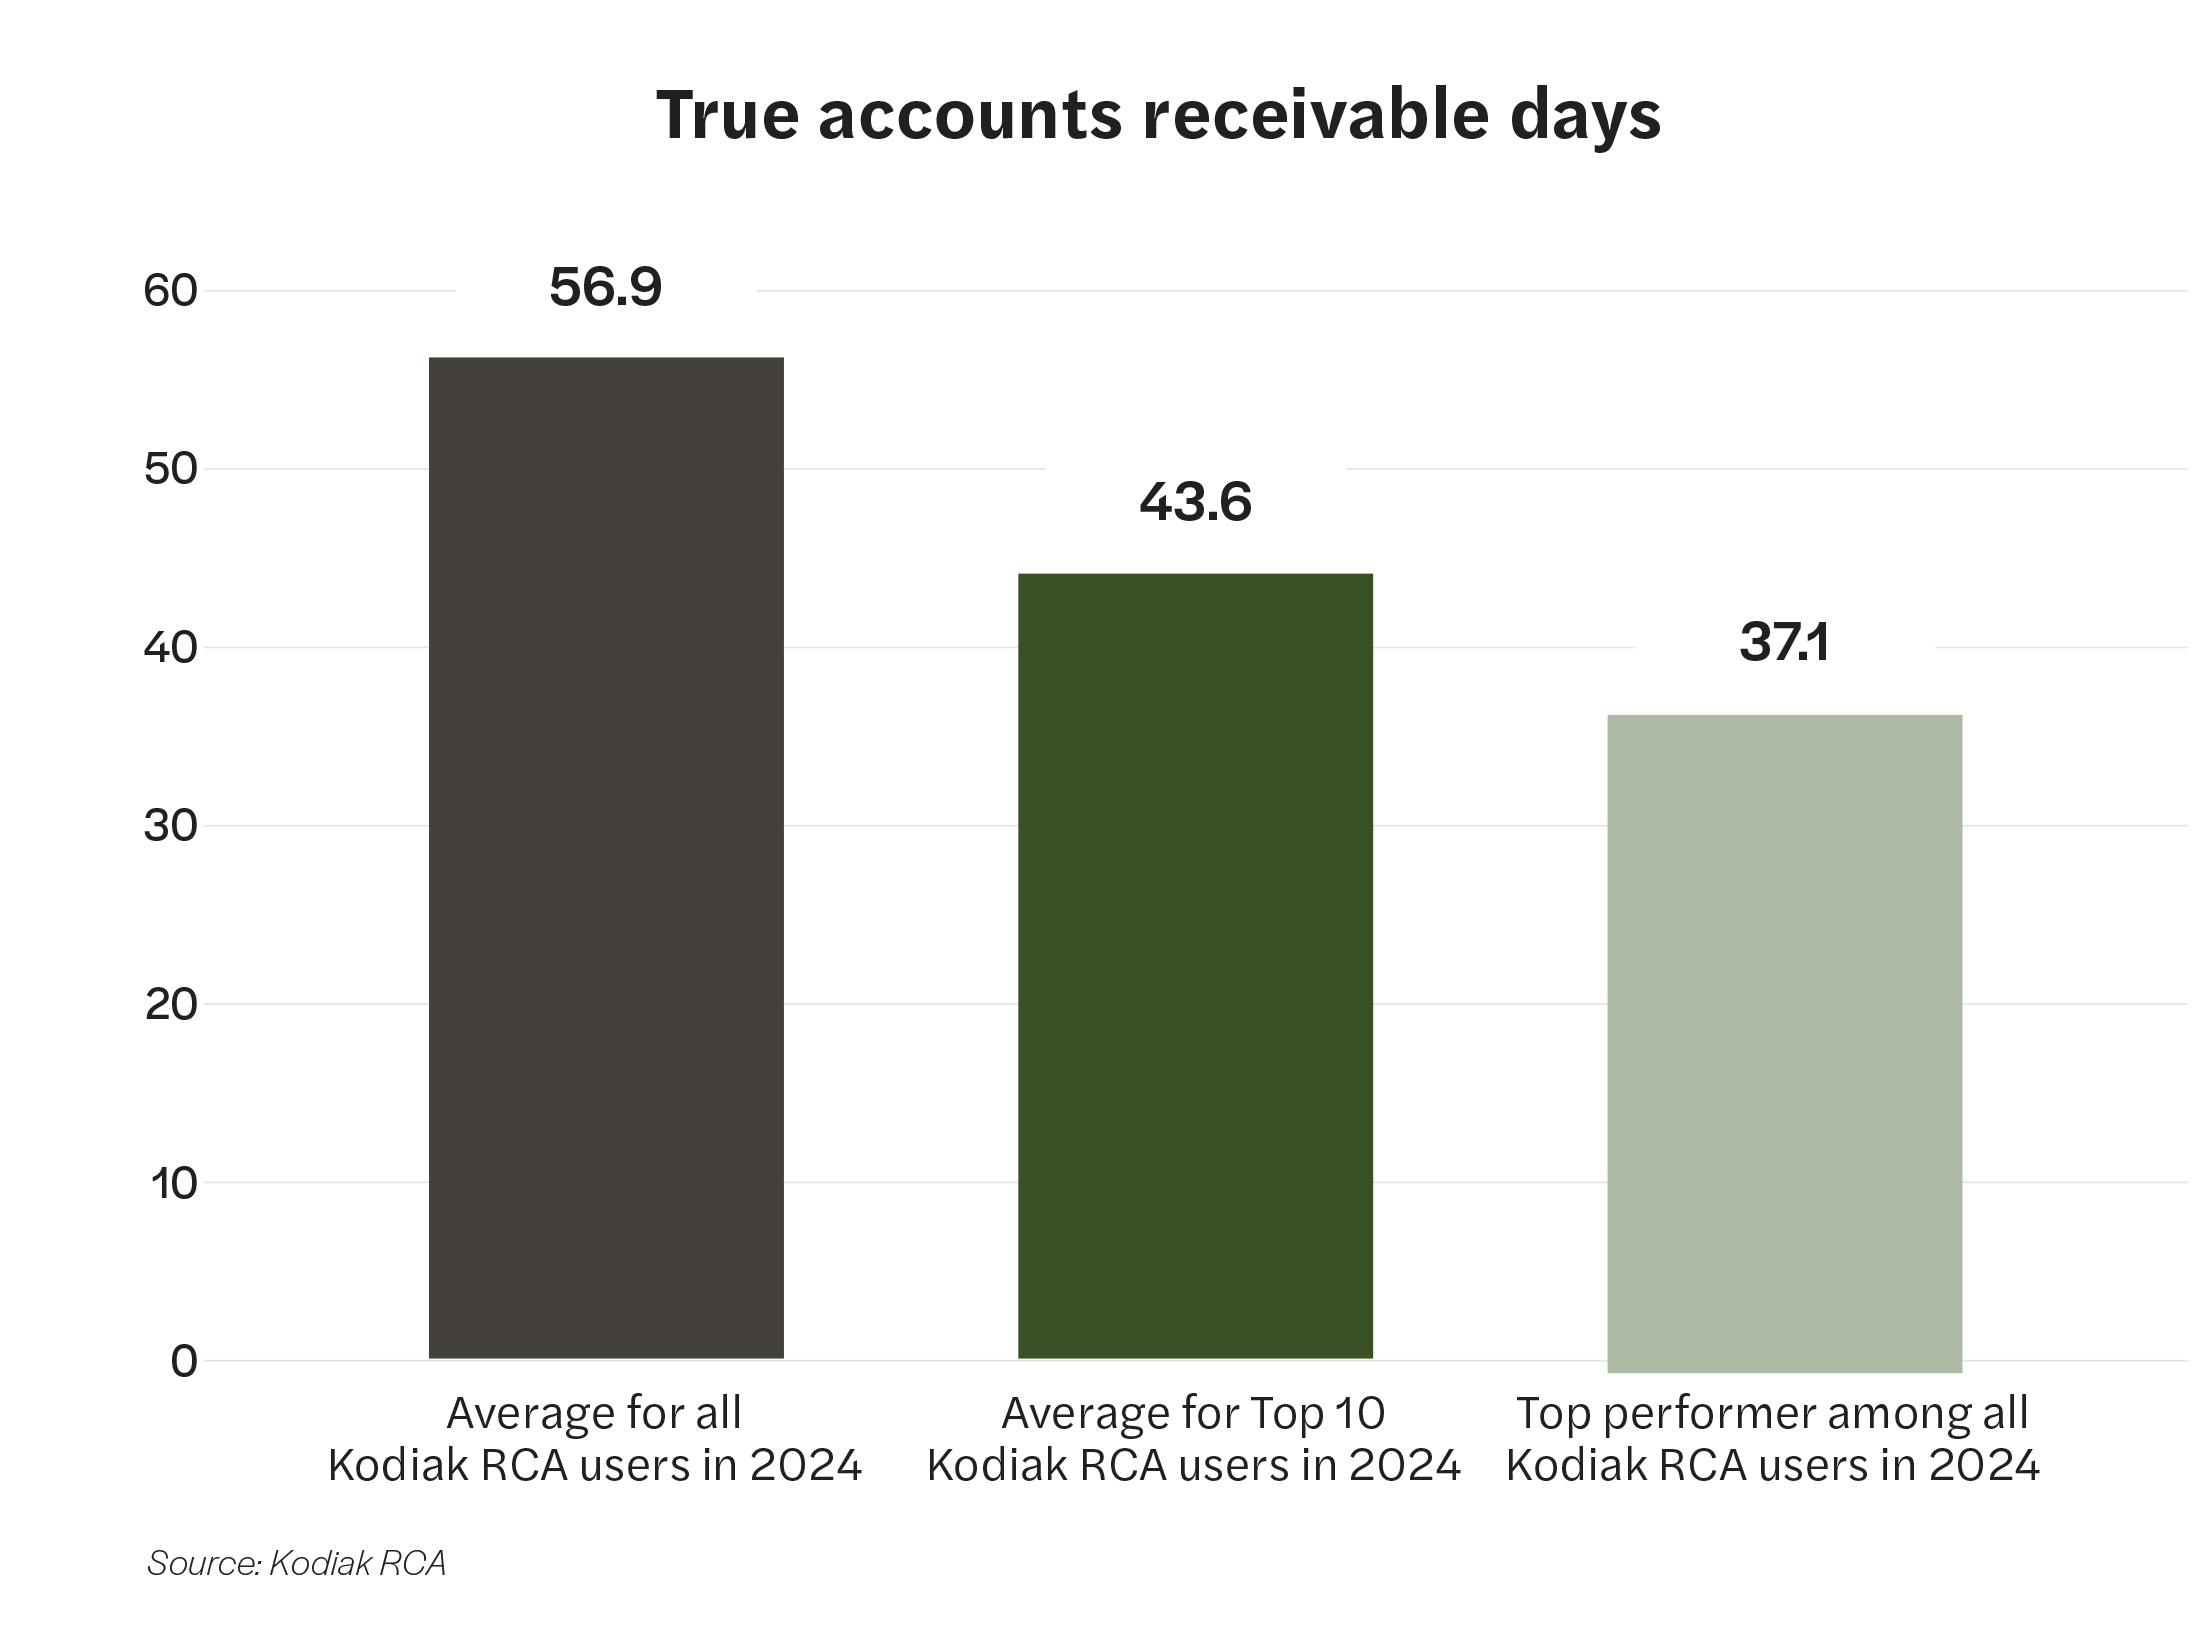
True accounts receivable days at the top-performing RCA user were nearly 35% lower than the average for all RCA users in 2024.
Performance tip
To better control true A/R days, organizations should do detailed reviews of specific front- and back-end revenue cycle processes that contribute to increased initial denials in these two categories—RFI denials and denials for commercially insured inpatients. Clinical teams must document all the services provided accurately and quickly. That will help denials management teams streamline processes to get payors the appropriate information/medical records as needed. Organizations must follow up with payors on these claims on a regular cadence to push for a resolution, whether that’s getting paid or receiving a more descriptive denial to address any actual issues with the claims.
KPI 2: True accounts receivable days greater than 90 days
Insight
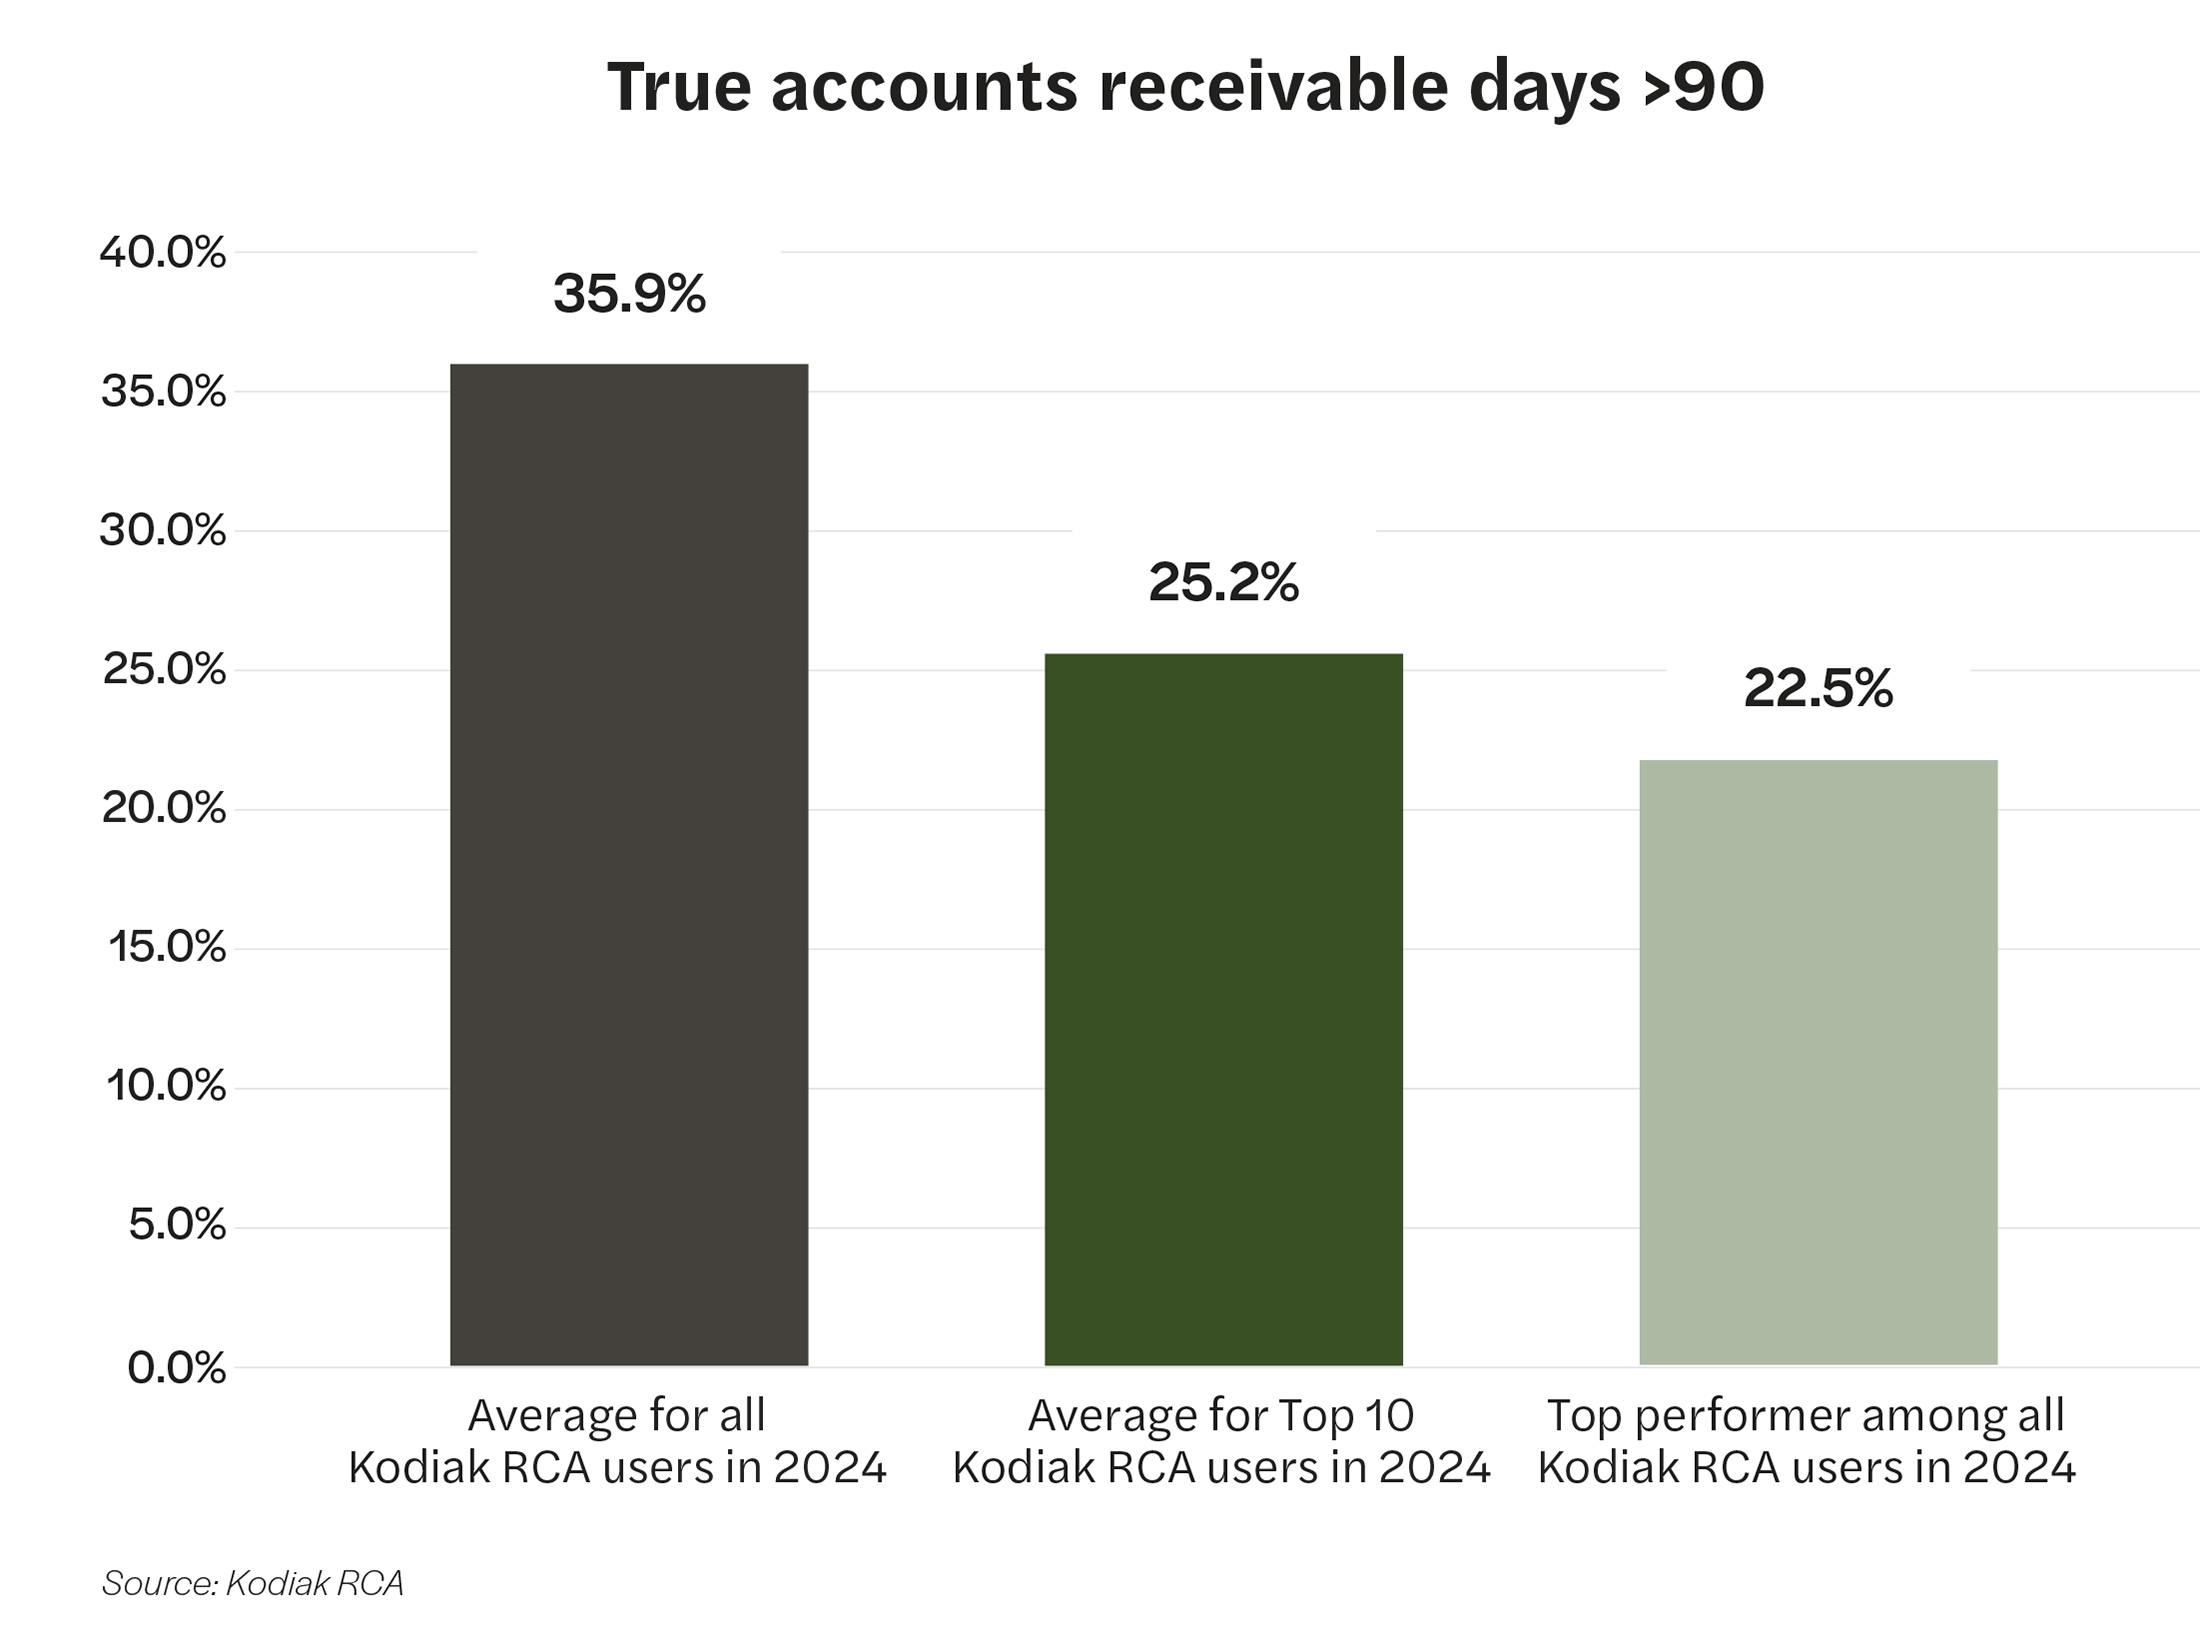
The percentage of true accounts receivable days greater than 90 days at the top-performing RCA user was 22.5%, compared to 35.9%, the average for all RCA users in 2024.
Performance tip
Organizations should focus on reducing aging accounts receivable by improving preregistration and authorization workflows to limit prior authorization and precertification denials. Organizations also should strengthen follow-up efforts to prioritize older claims and resolve them more efficiently.
KPI 3: Credit days
Insight
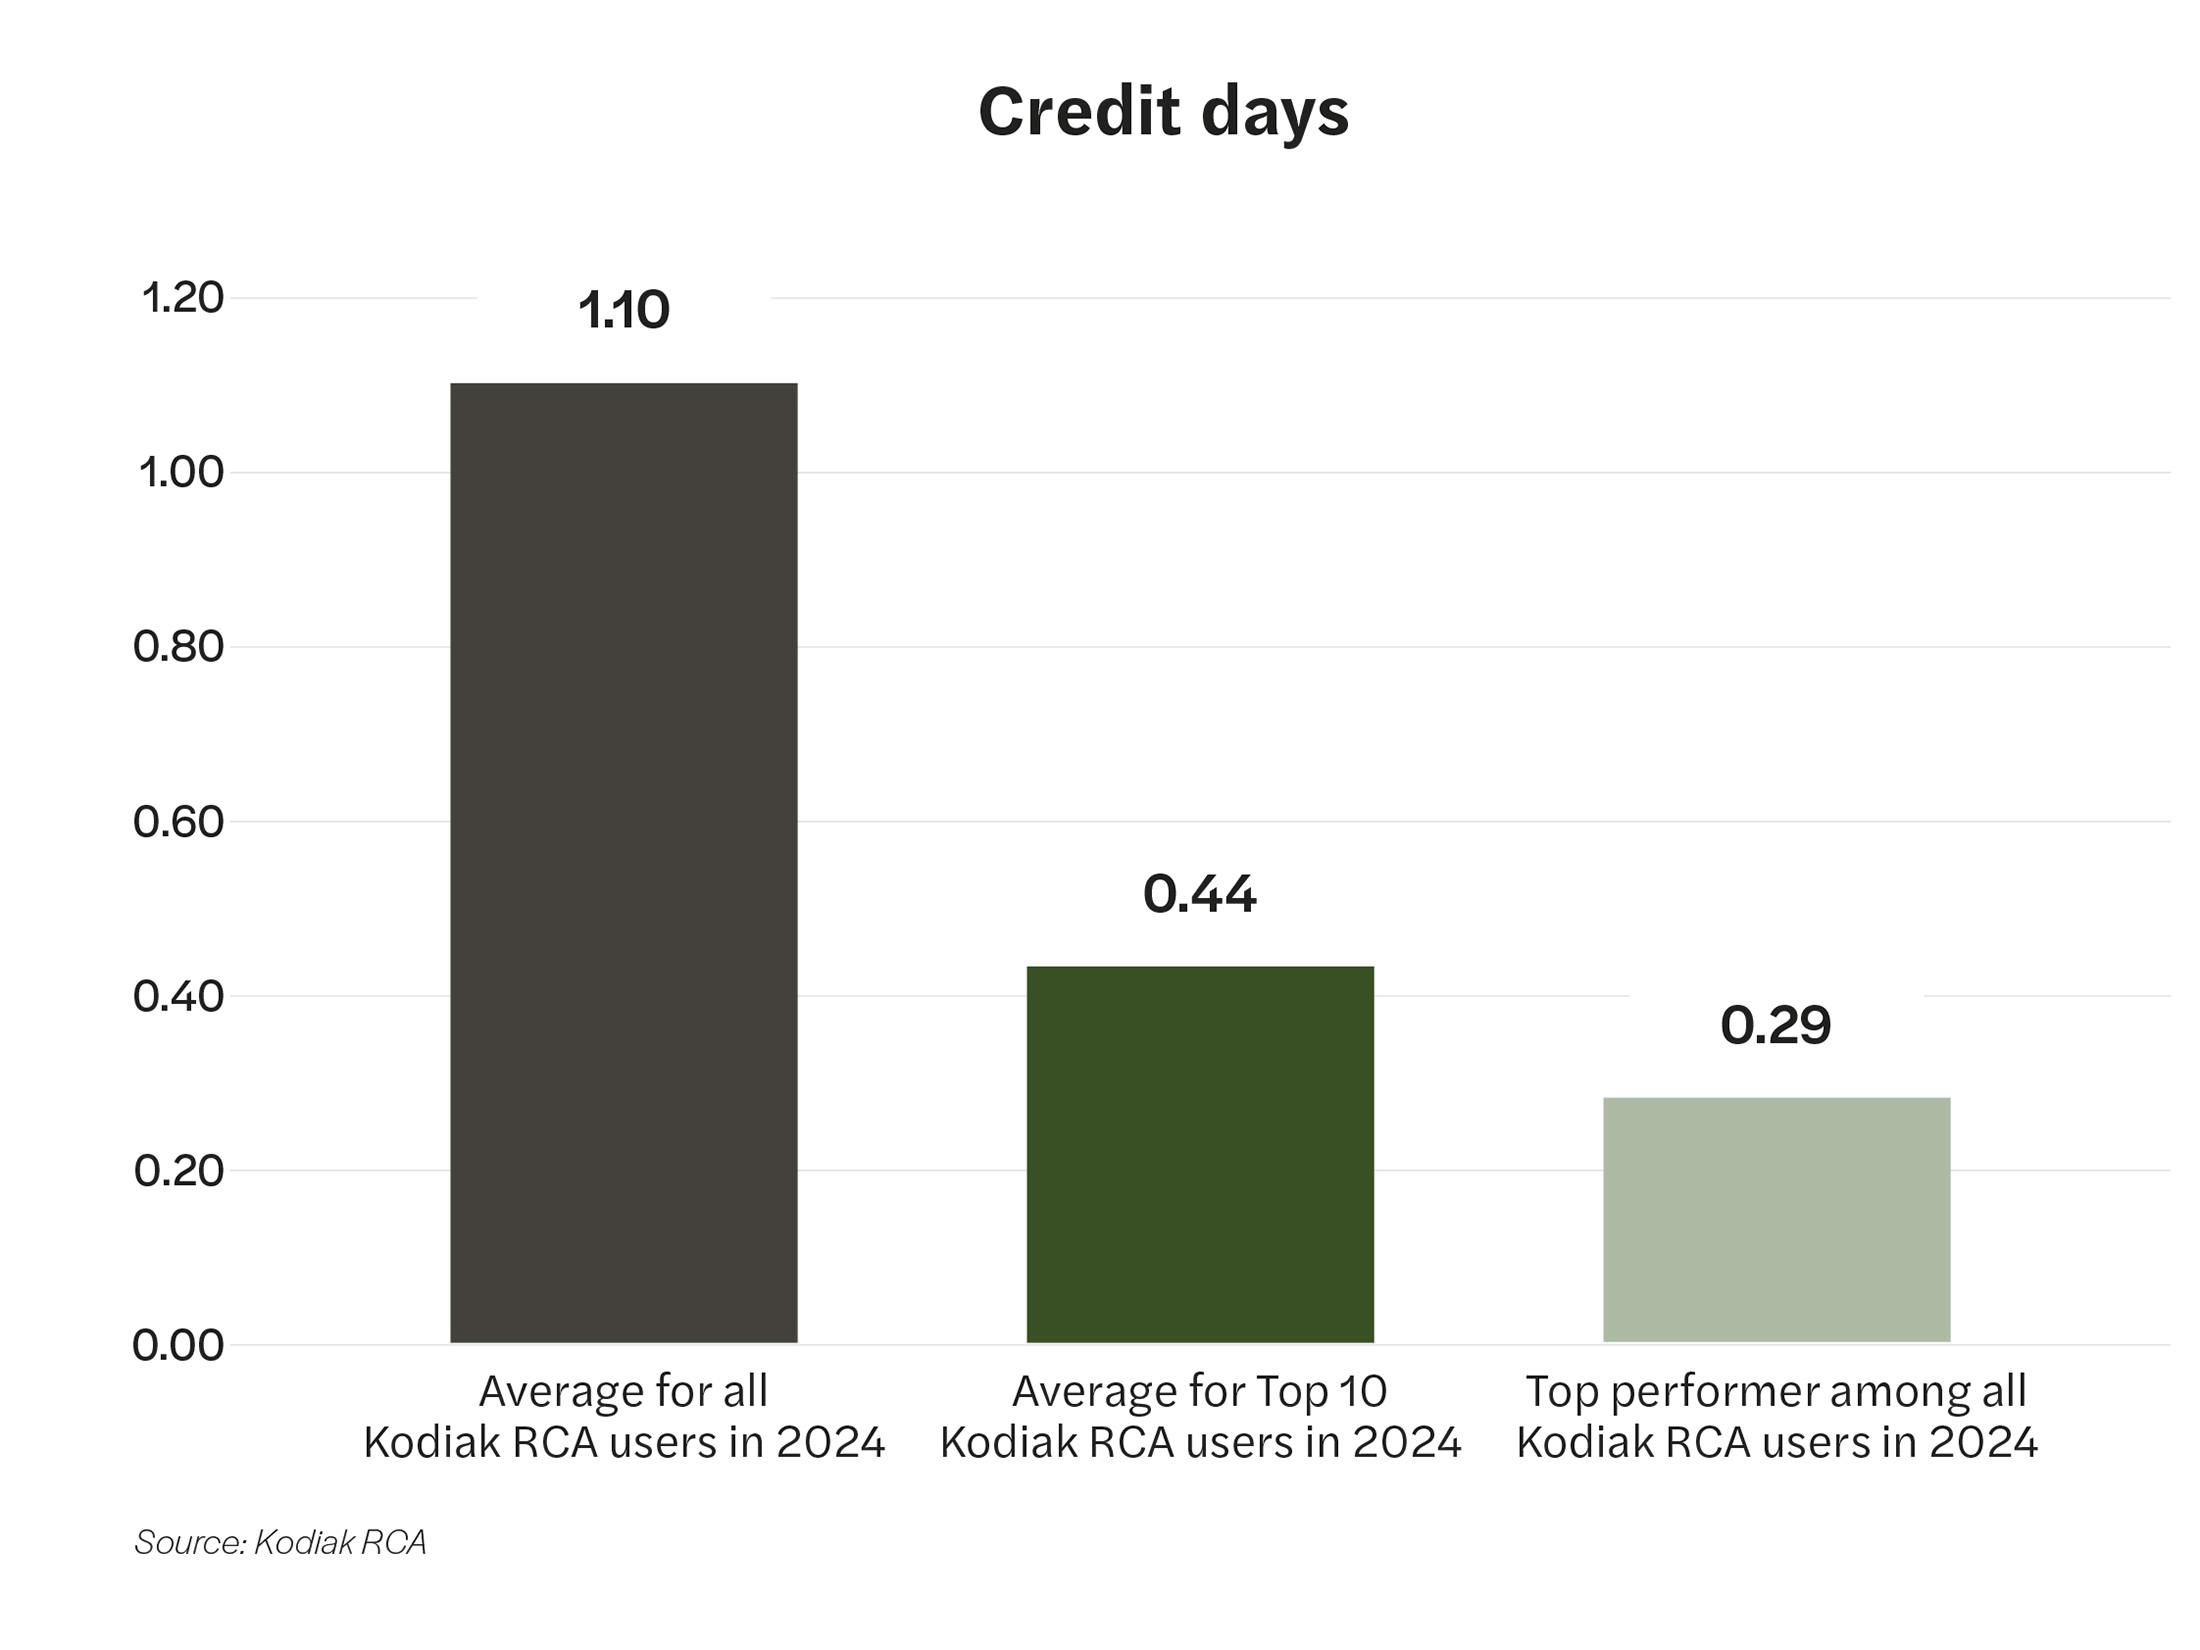
The average number of credit days at the top-performing RCA user was nearly 74% less than the average for all RCA users in 2024.
Performance tip
Credits resolution is an area of the revenue cycle that is ripe for automation by leveraging models that learn from historical resolutions to identify the appropriate resolving transaction or action. In addition, it’s important to remember to focus on the appropriate strategy for each type of credit balance. For example, a credit that qualifies as an exemption should be treated differently than a credit balance identified as an overcontractualization.
KPI 4: Days not final billed
Insight
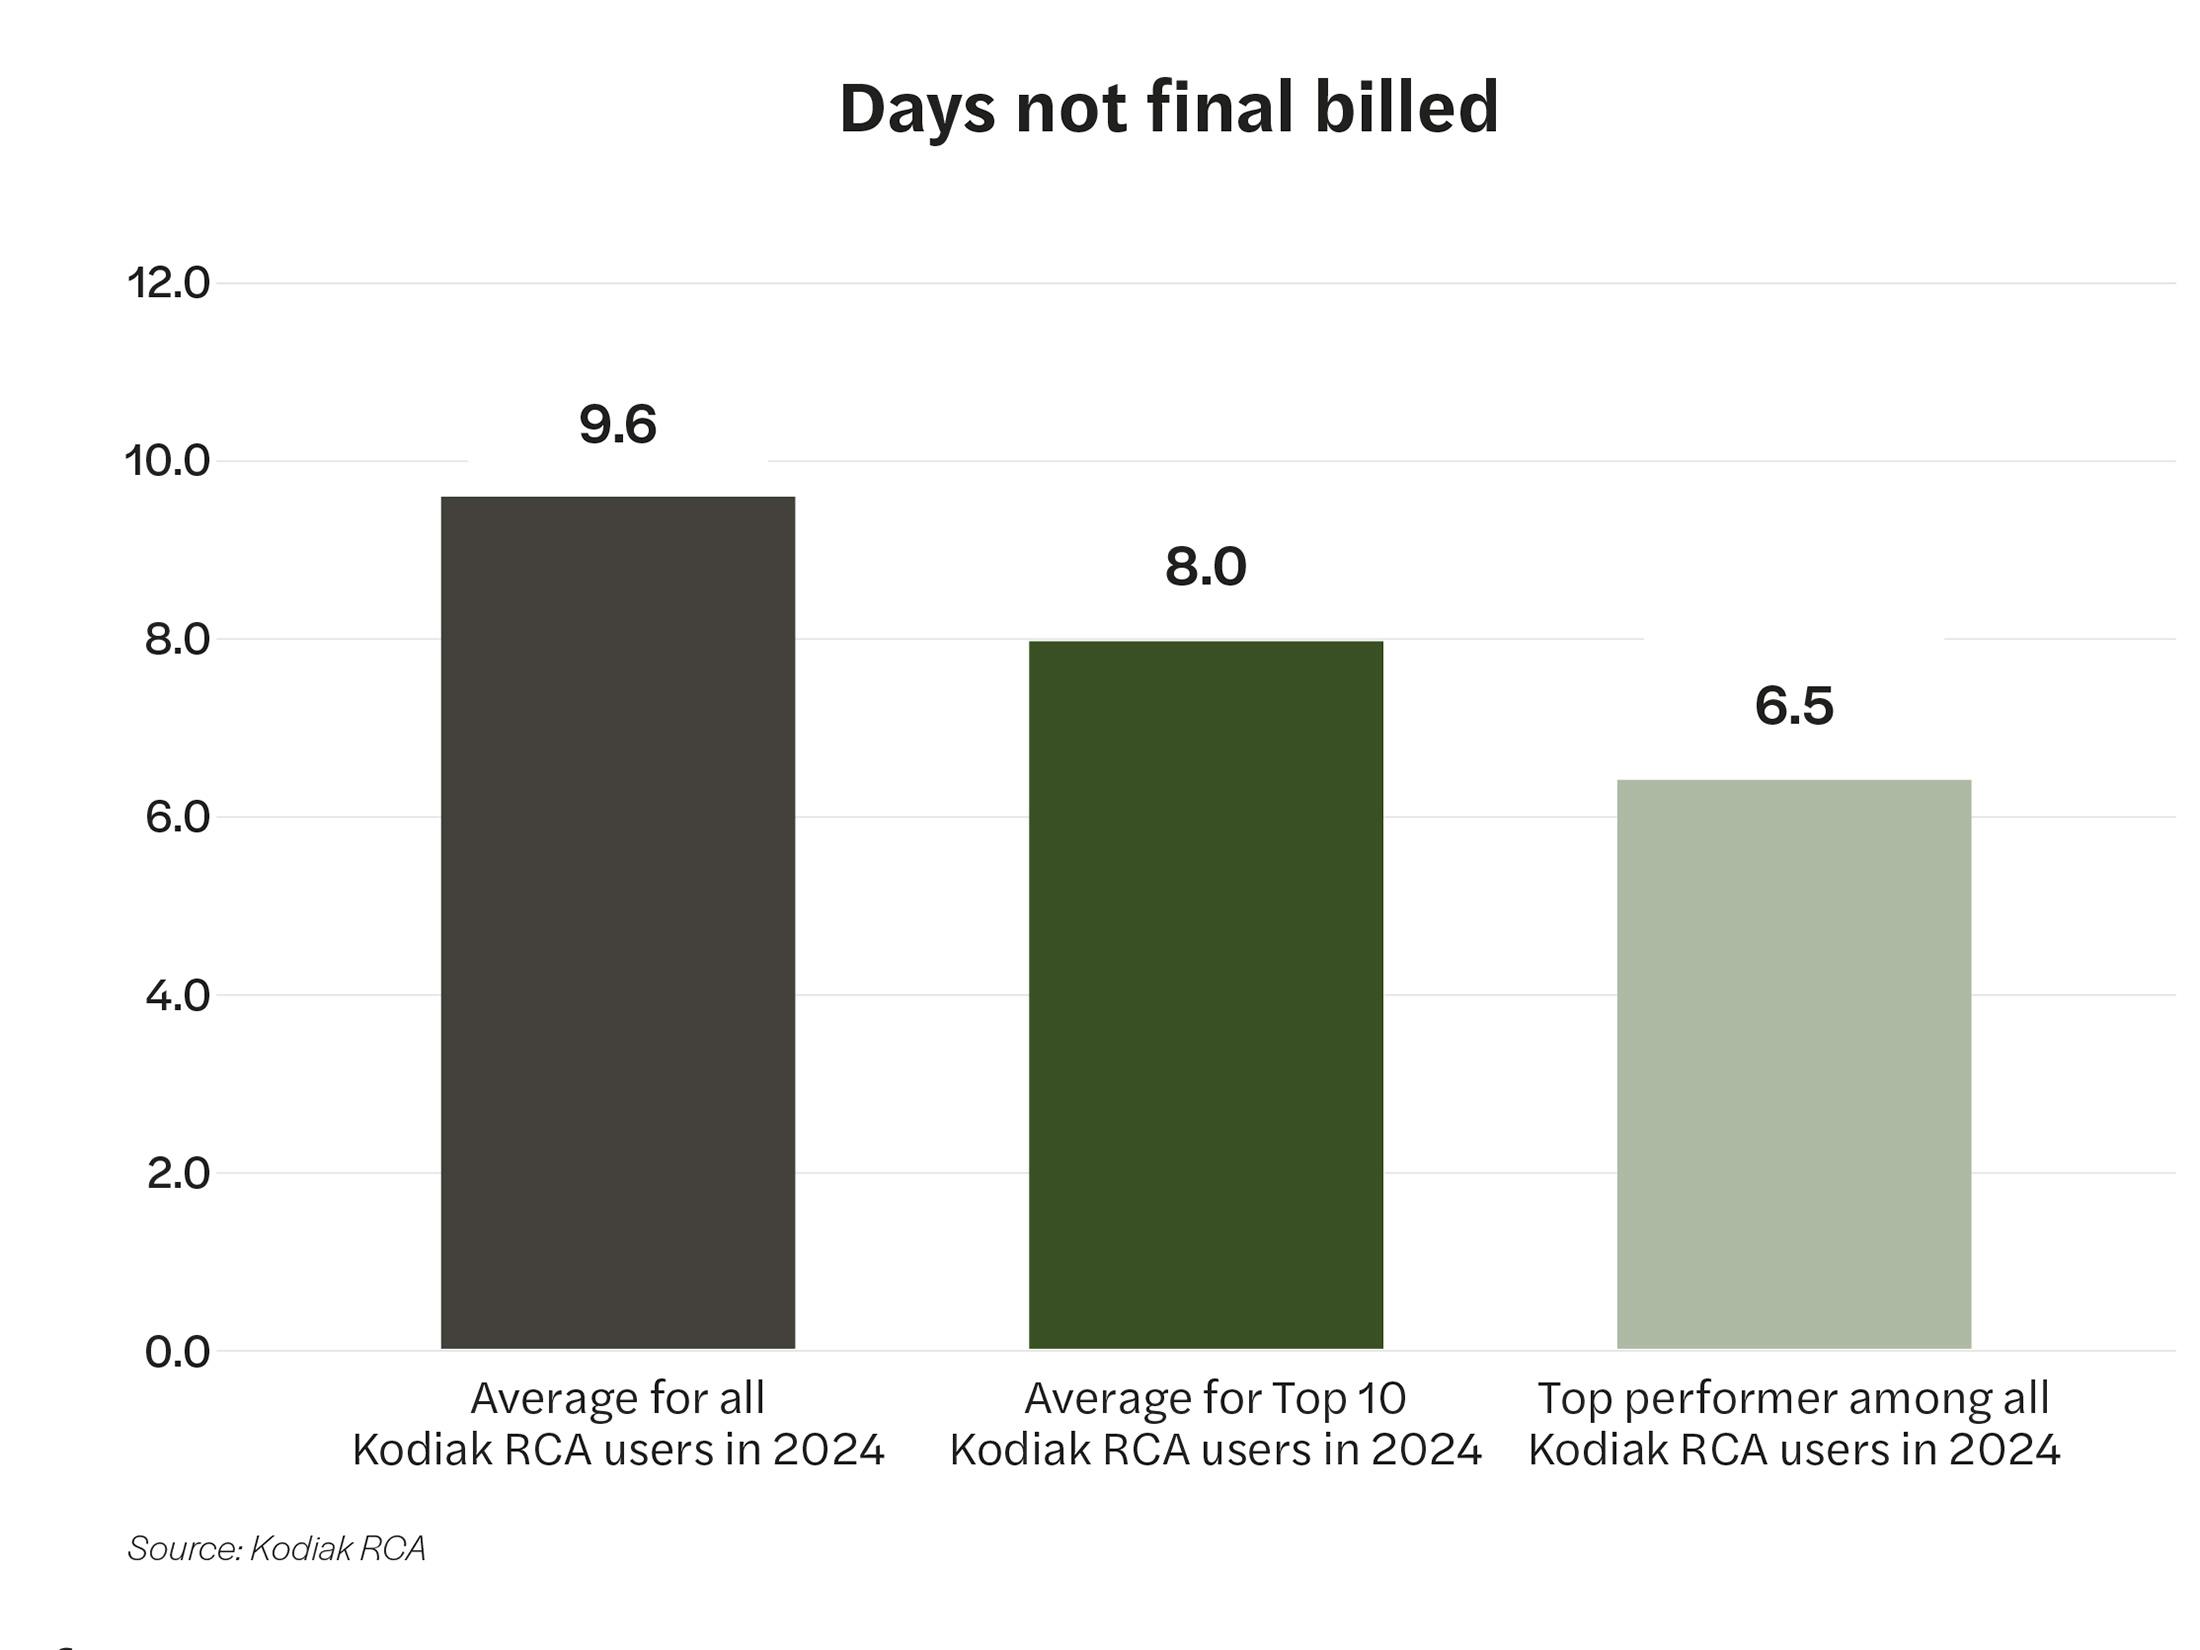
The average number of days not final billed at the top-performing RCA user was nearly a third less than the average for all RCA users in 2024.
Performance tip
Maintaining strong performance on unbilled accounts requires alignment across more than just your revenue cycle team. Quick turnaround times on physician queries related to high-dollar accounts is a strong indicator of strong unbilled performance, but this requires alignment between clinical and operational stakeholders.
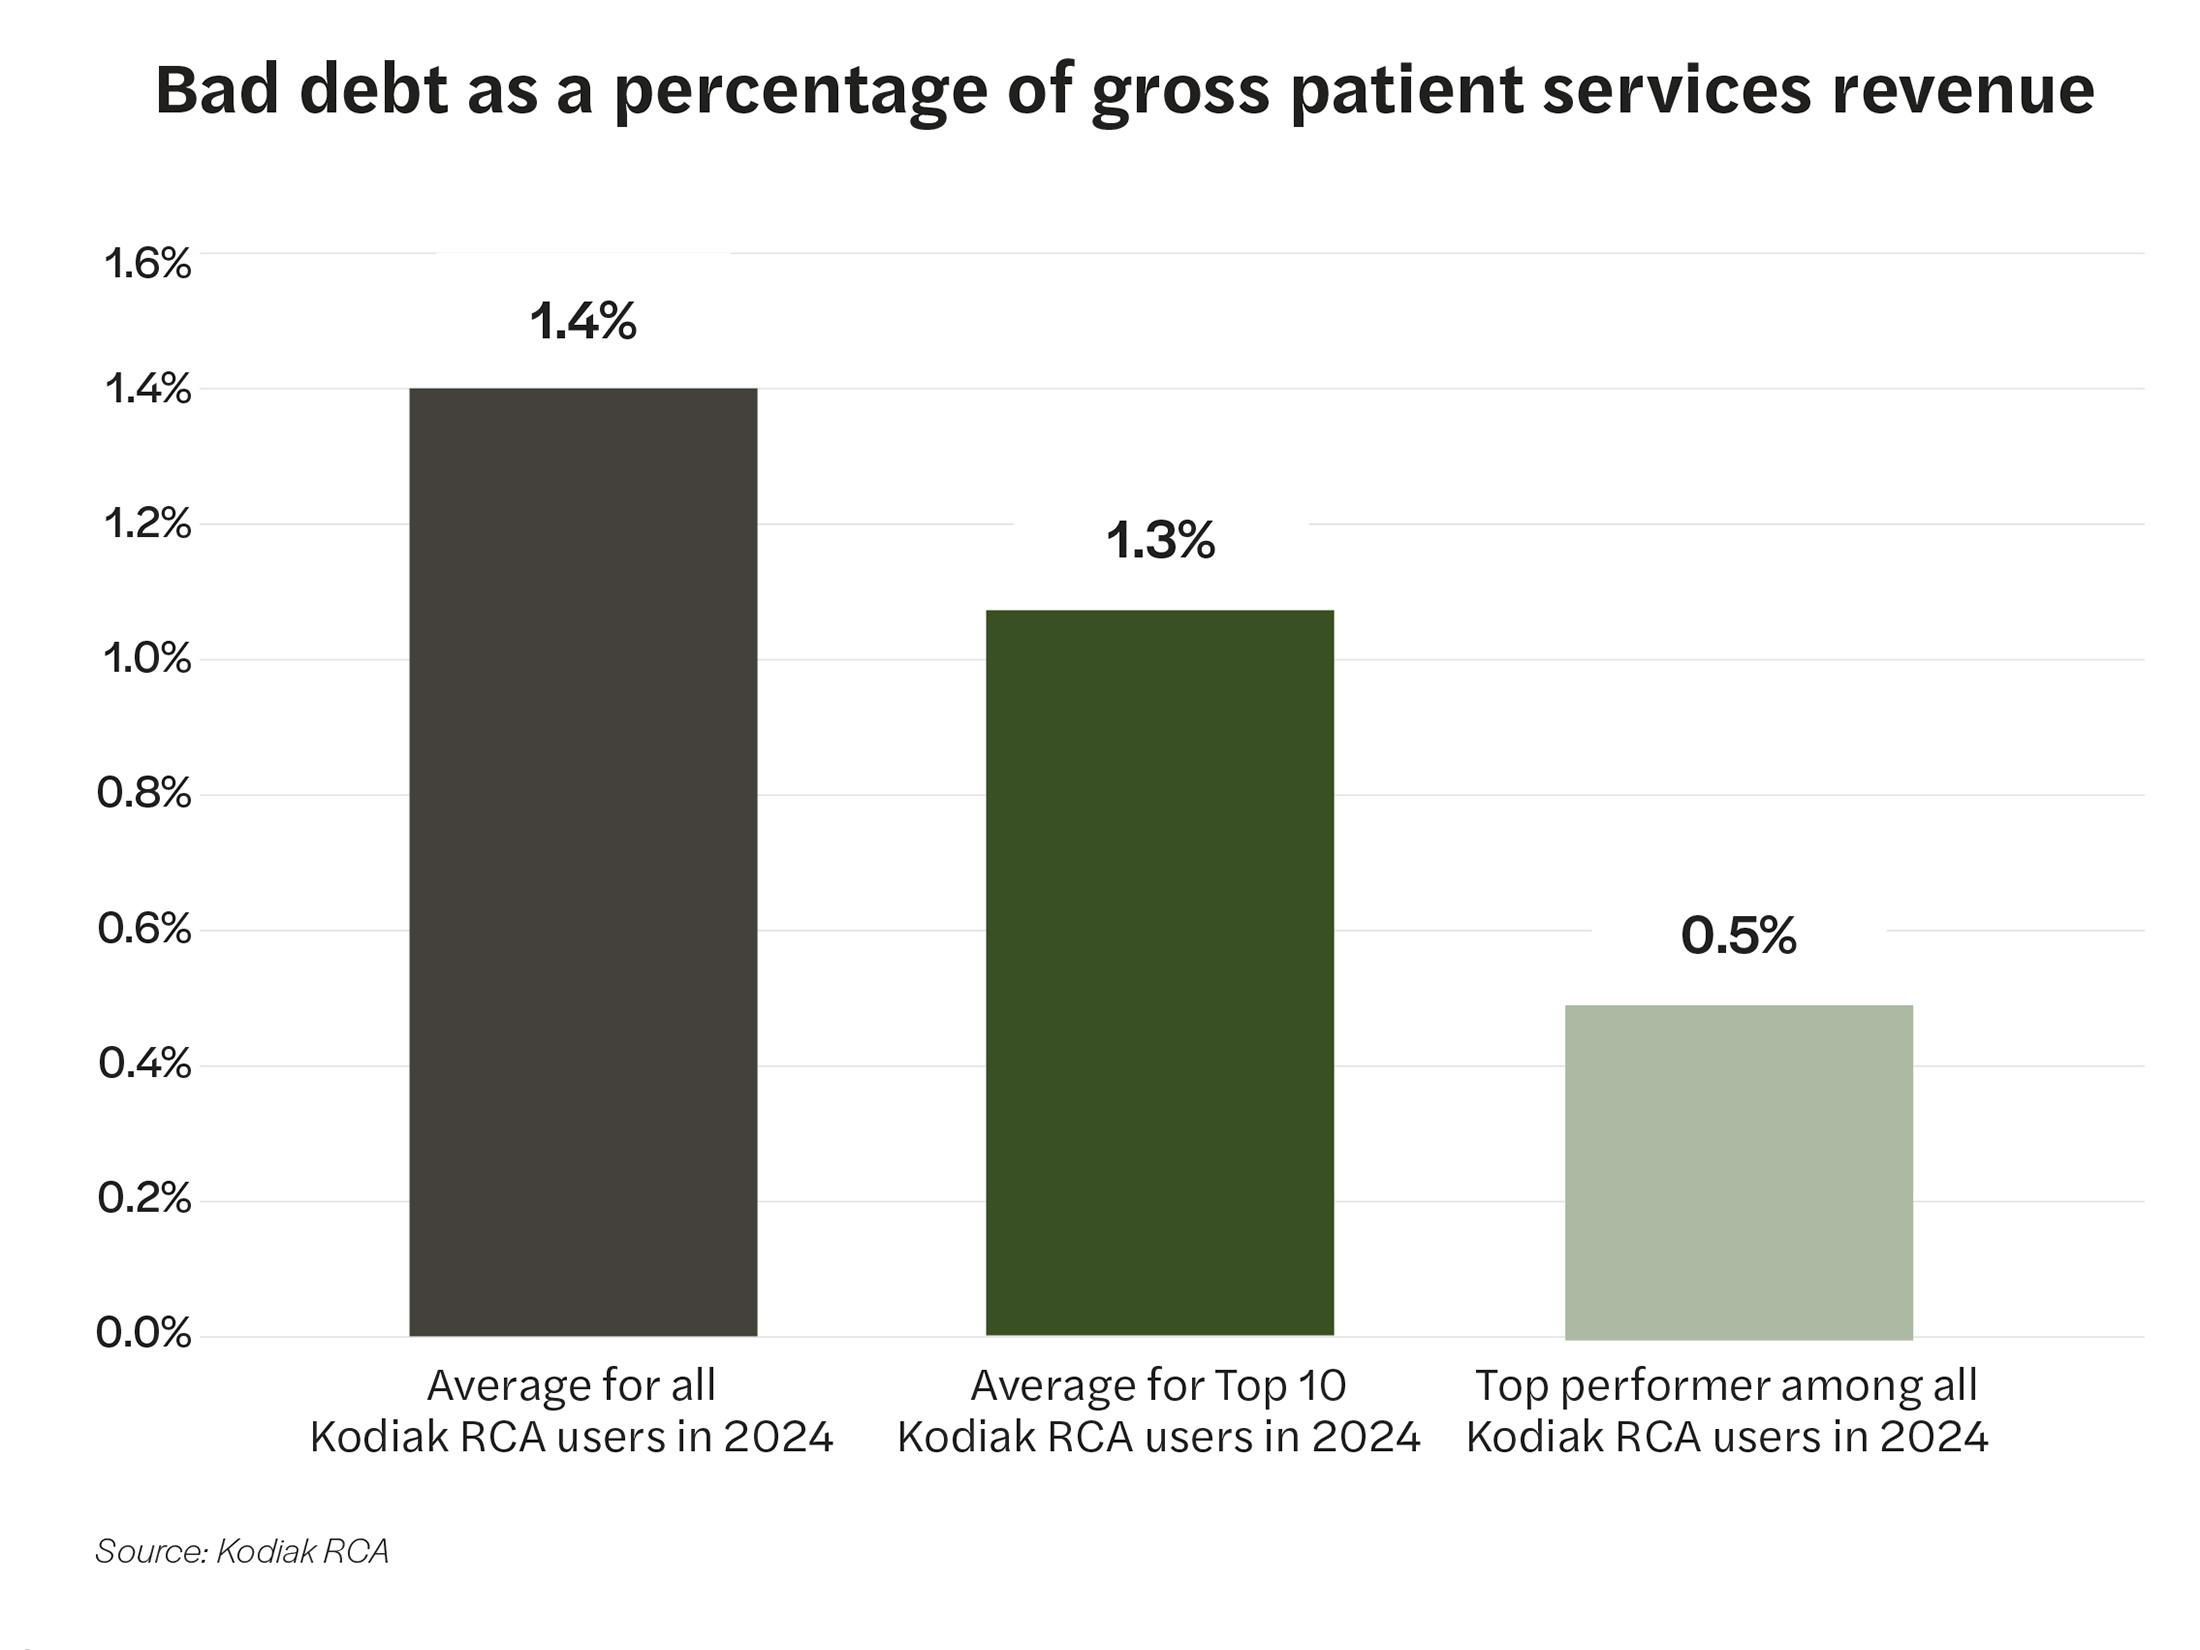
KPI 5: Bad debt as a percentage of gross patient service revenue
Insight
The percentage of gross patient service revenue ultimately written off as bad debt at the top-performing RCA user was more than 64% less than the average for all RCA users in 2024.
Performance tip
Point of service cash collections is one of the largest indicators of eventual bad debt performance, especially with over 50% of bad debt transactions now taking place on insured accounts. Implementing patient education at the front end of their experience not only will improve their patient financial experience, but it has a material impact on an organization’s net revenue leakage.
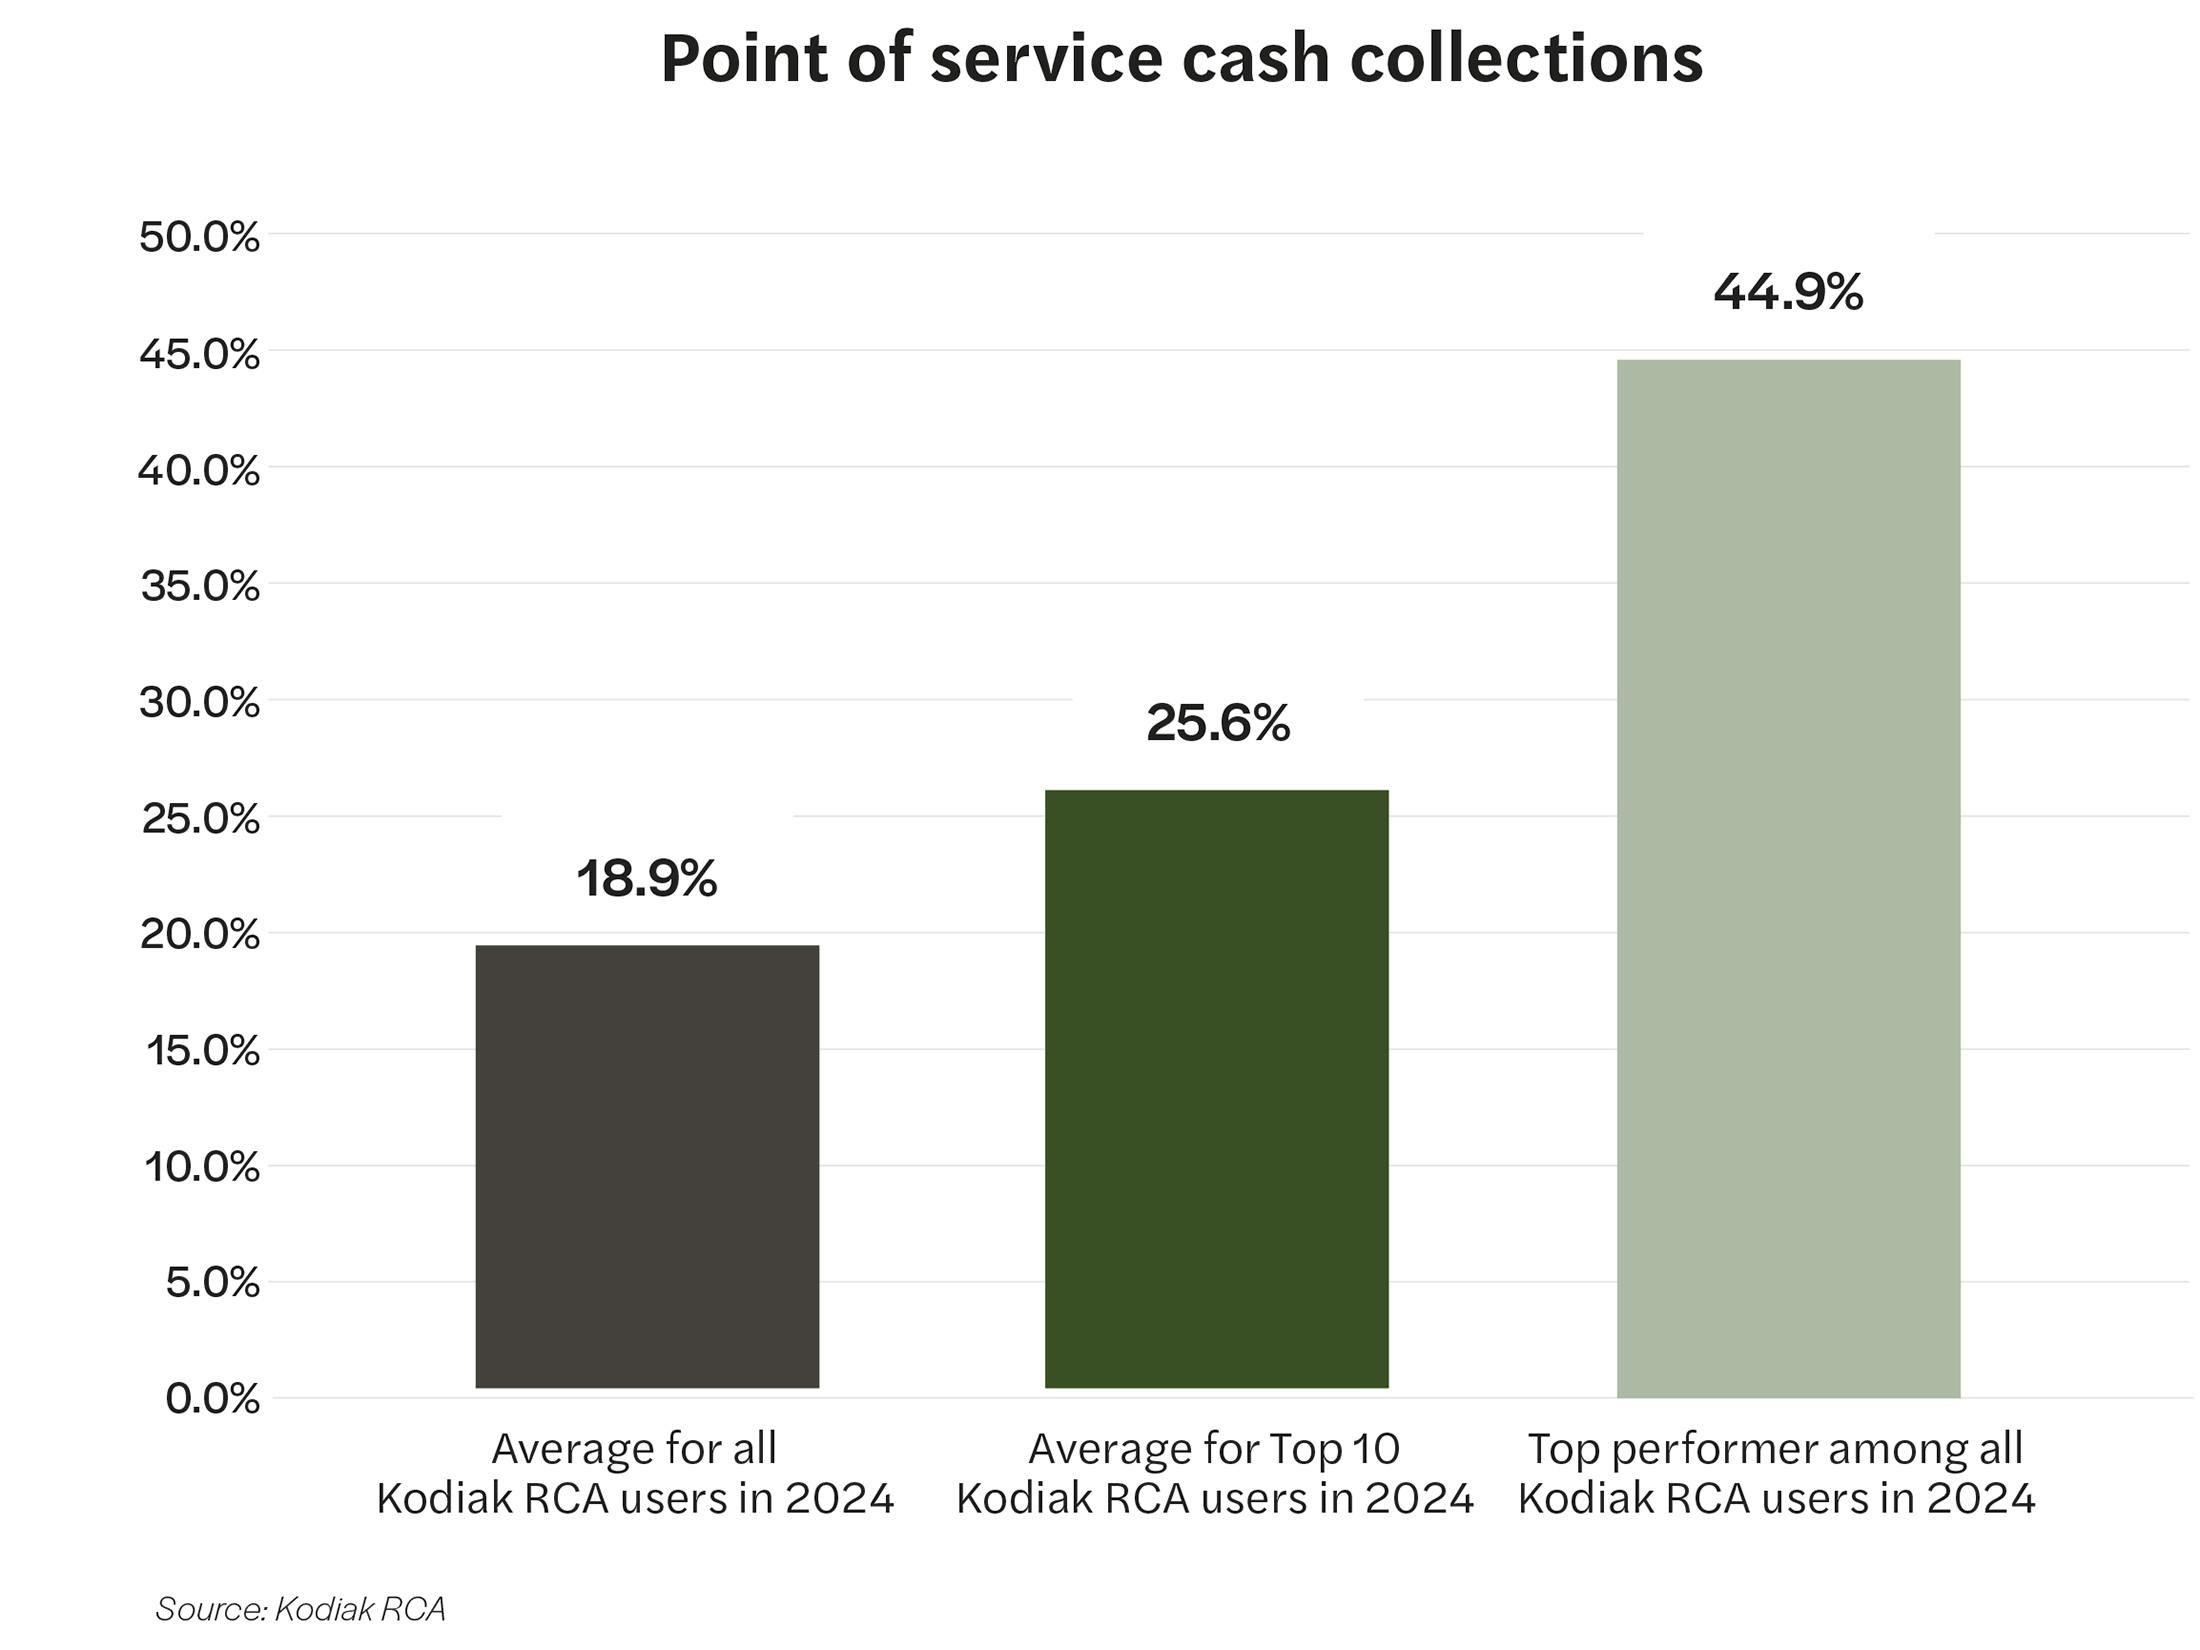
KPI 6: Point of service cash collections
Insight
The percentage of point of service cash collections at the top-performing RCA user was nearly two-and-a-half times higher than the average for all RCA users in 2024.
Performance tip
To improve and sustain positive momentum in POS cash collections, organizations must continue training staff and using tools that make it easier to capture cash payments at the point of service.
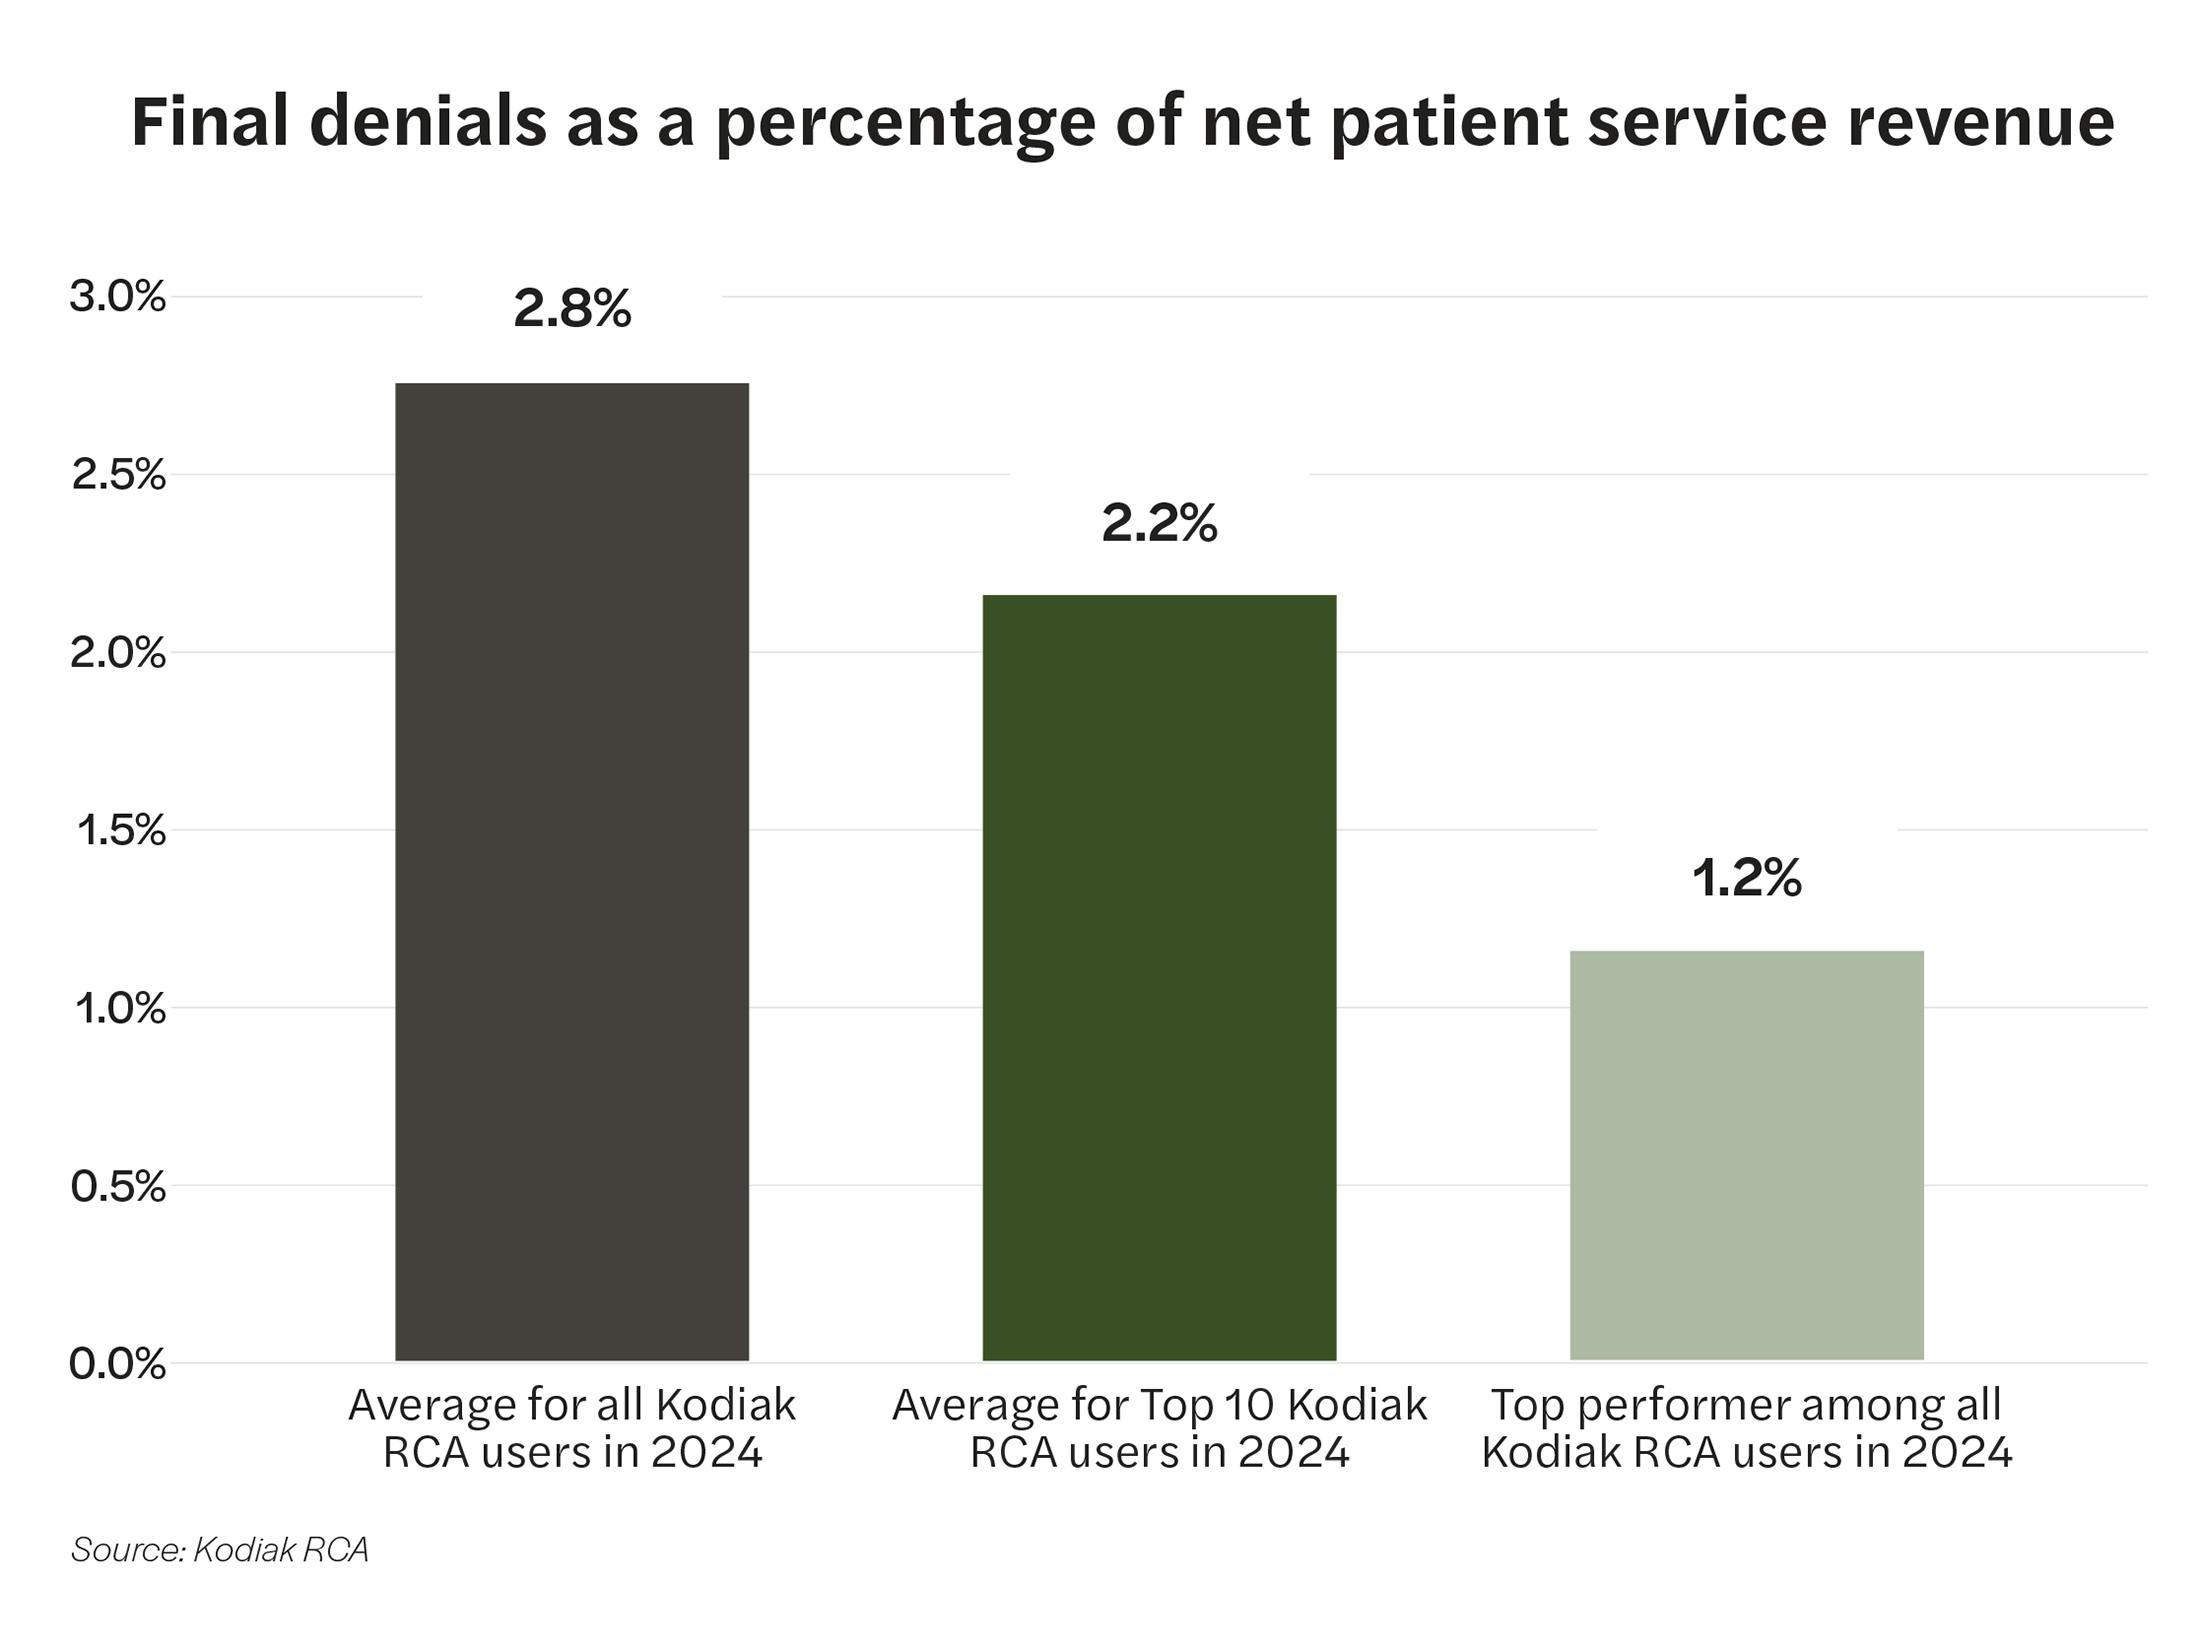
KPI 7: Final denials as a percentage of net patient service revenue
Insight
The final claim denial rate at the top-performing RCA user was less than half of the average rate for all RCA users in 2024.
Performance tip
Integrate clinical departments into revenue cycle operations. Use better and more advanced analytics to identify and mitigate root causes of denials. Set up distinct and resourced task forces to deal specifically with claim denials.
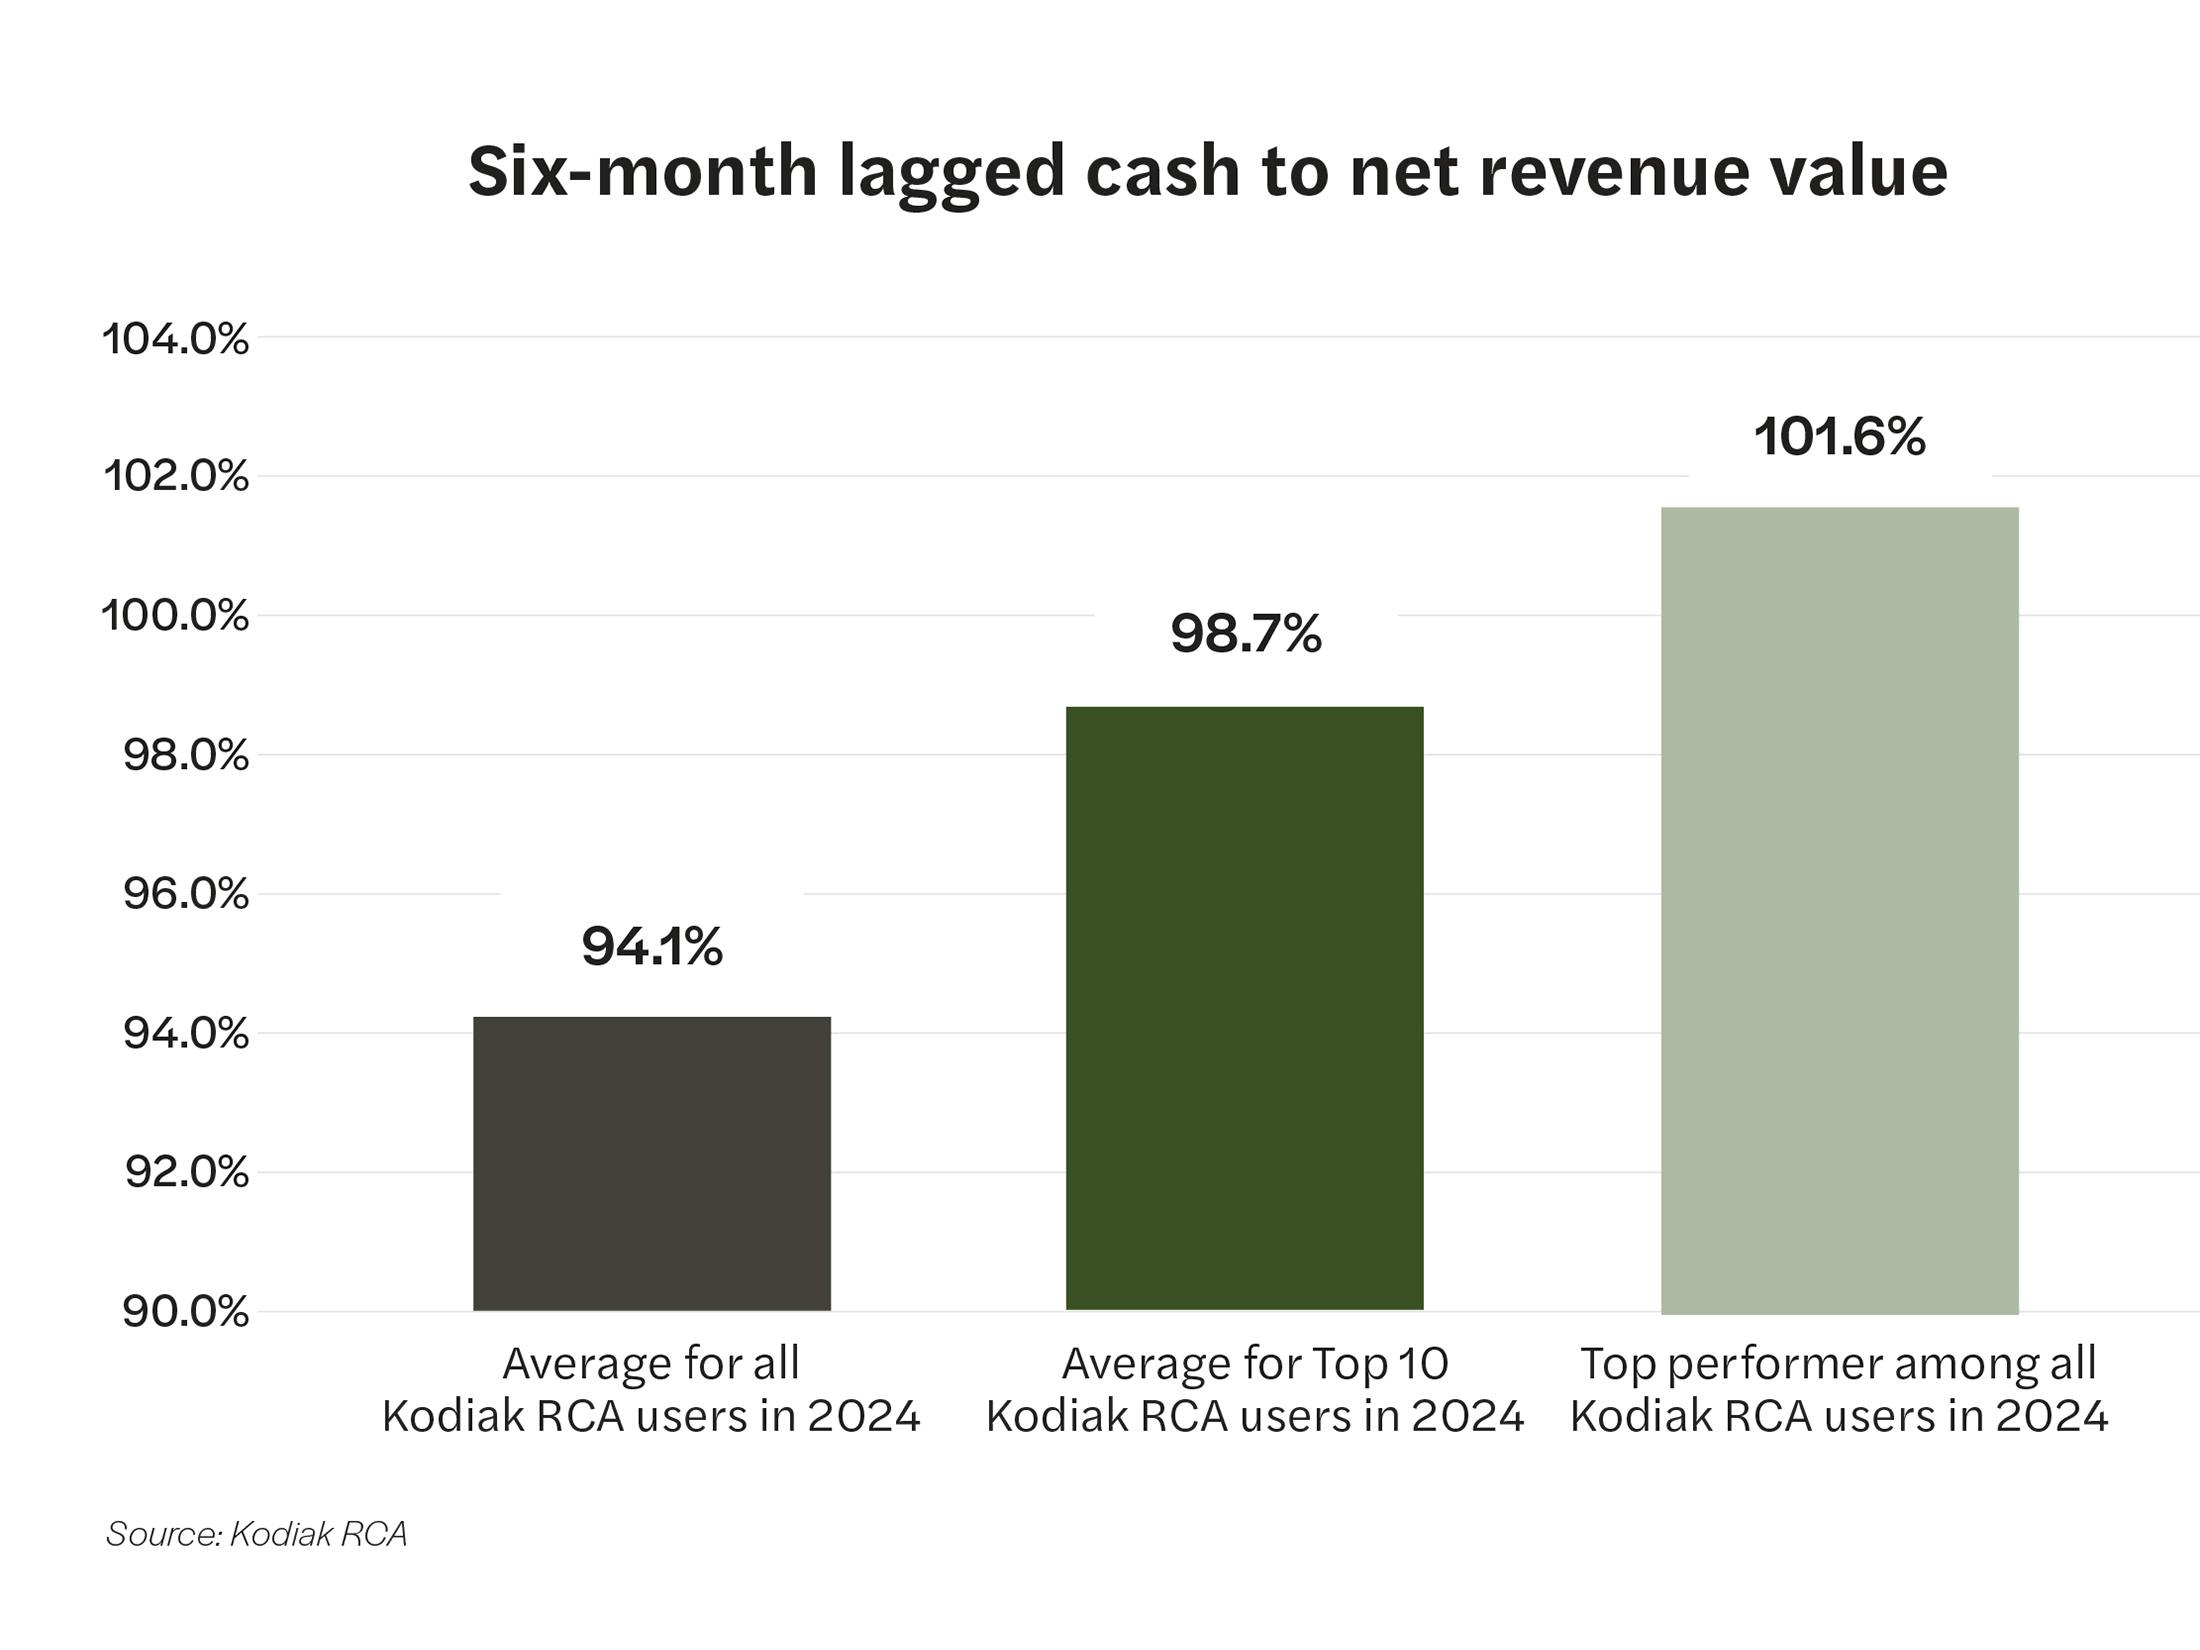
KPI 8: Six-month lagged cash to net revenue value
Insight
The percentage of six-month lagged cash to net revenue value topped 100% at the top-performing RCA user and was about 8% higher than the average rate for all RCA users in 2024.
Performance tip
Focus on timely follow-up on administrative denials by leveraging your denials analytics to prioritize denials that have a large likelihood of being overturned and have a high cash impact. In addition, focus on high-dollar unbilled accounts to avoid delays in claim submission for high-dollar claims.

Closing the performance gap
The data is the data. It reveals wide variations in the revenue cycle performance among Kodiak RCA users. The good news is that savvy revenue cycle leaders can convert performance gaps into opportunities to transform their people, processes, and technologies to drive dramatic improvement.
In addition to the performance improvement tips for the eight revenue cycle KPIs analyzed for this report, we curated three best-performance takeaways from interviews we conducted with the recipients of our annual Revenue Cycle Performance Awards.
We found that the winning organizations shared three attributes:
- They clinically integrated their revenue cycle, meaning clinician leaders work hand in hand with revenue cycle leaders to enhance each other’s clinical and revenue cycle performance.
- They had strong ownership of core revenue cycle performance metrics. Designated revenue cycle team members are responsible for tracking and improving specific KPIs like denials.
- They had strong relationships with their payors. Complemented and supported by data, they were in a position to influence payor behaviors in positive ways.
In addition to those three overarching attributes, we also queried attendees of Kodiak’s invitation-only Revenue Circle conference, held Jan. 26-28 in Scottsdale, Arizona, on their specific strategies and tactics to improve their revenue cycle performance. Their eight top ranked answers were:
- Clinical integration
- Payor/legal escalations
- Automation of low-value accounts
- Better analytics
- Generative AI for appeal letters
- Front-end process enhancement
- Establishing a task force
- Focus on DRG downgrades
Why be average in your revenue cycle performance when you can be among the top-performing healthcare organizations in the country? The revenue cycle specialists at Kodiak can help you make the leap.


